Unlocking the Immune Map: A Spatial Journey Through Lymphoid Tissues
Alright, let’s dive into something seriously cool happening in the world of immunology. We’re talking about getting up close and personal with some fascinating immune cells, specifically the ones called Innate Lymphoid Cells, or ILCs for short. Now, these aren’t your typical T or B cells with their fancy, custom-built receptors for spotting invaders. ILCs are more like the rapid response team, hanging out in our tissues, ready to jump into action based on signals from their environment. They’re super important for keeping things balanced, fixing stuff up, and being the first line of defense, especially at those crucial barrier surfaces like our gut and skin.
Think of ILCs as the innate cousins of T helper (Th) cells. Just like Th cells come in different flavors (Th1, Th2, Th17) that specialize in different types of immune jobs, ILCs do too (ILC1, ILC2, ILC3, plus NK cells and LTi). They don’t need a specific antigen handshake to get going; cytokines are their activation key. Because they’re so adaptable and hang out right there in the tissues, they chat with all sorts of neighbors – other immune cells, structural cells, even neurons!
For a while now, folks have been really interested in these ILCs. They’re like the unsung heroes of the immune system, and understanding where they live and what they’re doing could open up new ways to tackle diseases, including cancer. But here’s the rub: figuring out exactly *where* these cells are located within human tissues, especially at a super detailed, single-cell level, has been tricky. Traditional methods like flow cytometry or RNA sequencing tell us *what* cells are there and *what they’re doing*, but they rip the cells out of their natural neighborhood, losing all that crucial spatial info. Imagine trying to understand a city by just counting its residents and knowing their jobs, but without a map!
That’s where this study comes in, and honestly, it’s a game-changer. We’re talking about using some seriously clever tech – multiplex immunofluorescence, multispectral imaging, and advanced computer vision – to create detailed maps of where ILCs and their Th cell counterparts are hanging out in human lymphoid tissues. Not just a blurry overview, but a single-cell resolution map across whole tissue slides. It’s like finally getting that detailed street map of the immune city.
Mapping the Immune Landscape
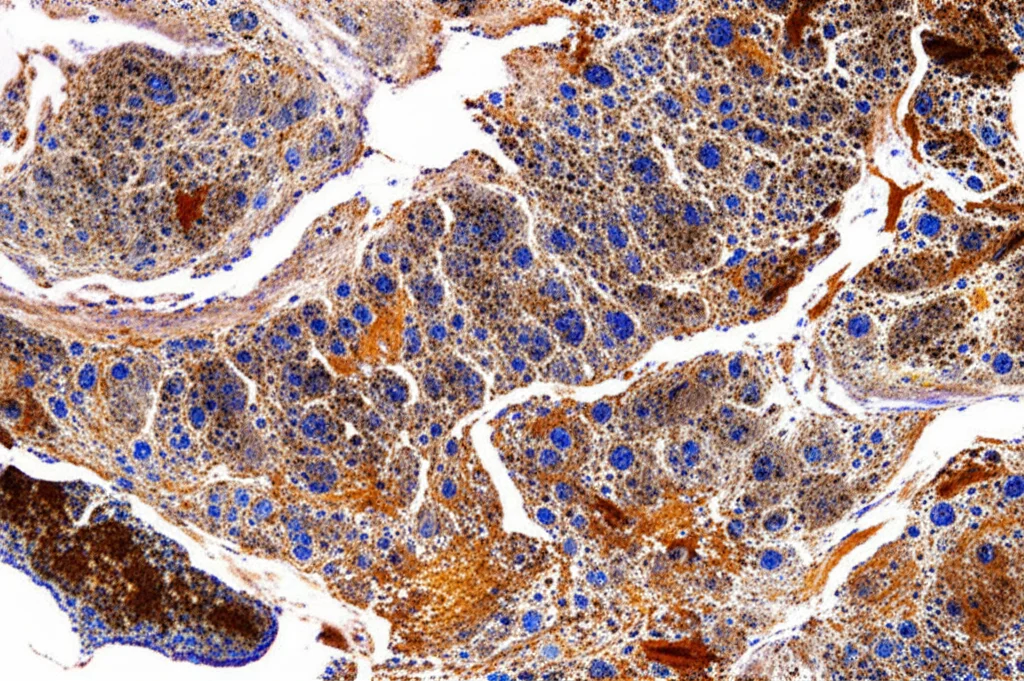
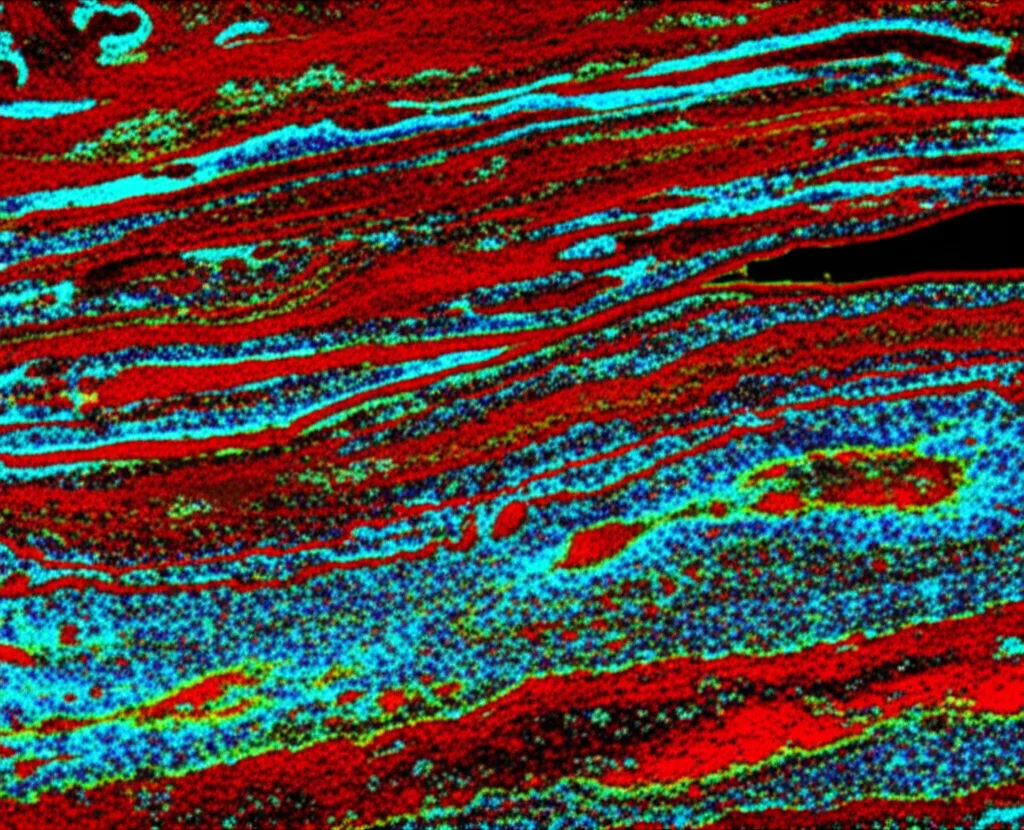
So, how did we pull this off? The core idea was to use a technique called multiplex immunofluorescence (mIF). This lets us stain for several different cell markers on the same tissue slice, using different fluorescent colors. Then, we used fancy scanners to capture multispectral images of the whole slide. But the real magic happens with the computer vision and analysis. We used software to identify individual cells based on their nuclei, figure out which markers each cell expressed, and then map their exact location (X-Y coordinates) on the tissue. This allowed us to calculate cell densities in different areas and, crucially, see who was hanging out near whom.
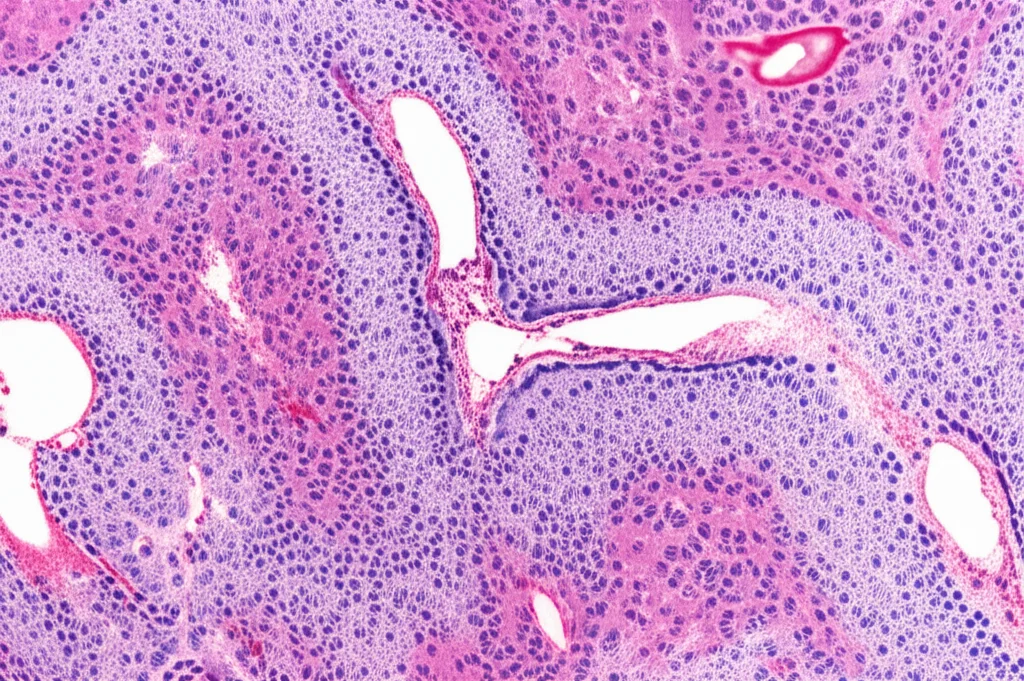
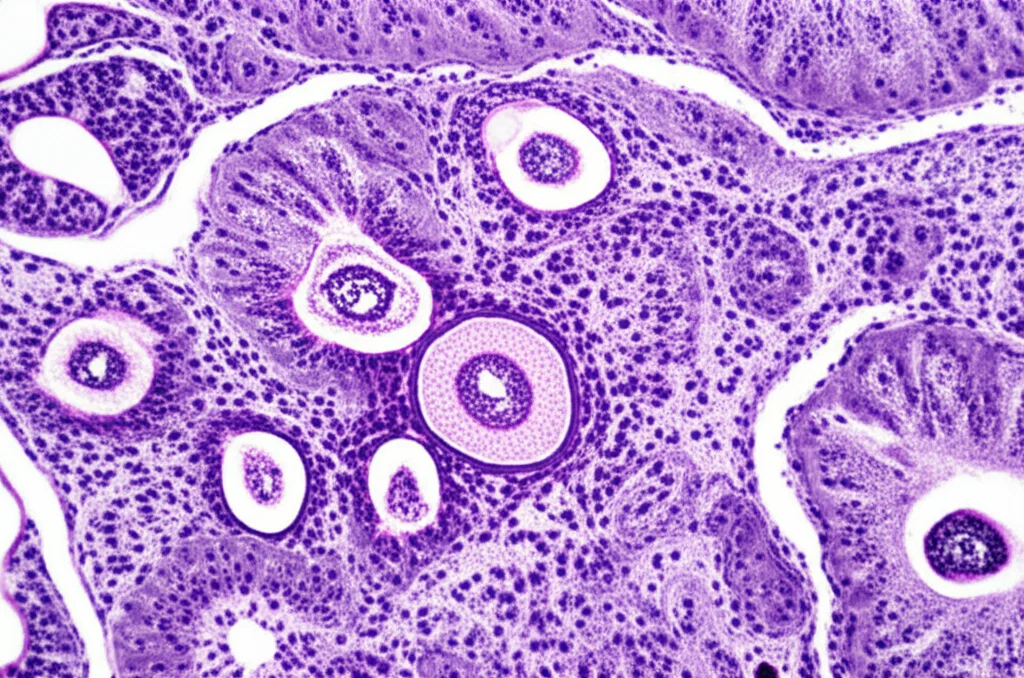
We looked at a bunch of different human lymphoid tissues: the thymus (where T cells grow up), lymph nodes and tonsils (key meeting spots for immune cells), the spleen (a major filter and immune hub), and parts of the gut-associated lymphoid tissue – the appendix and ileum (critical for mucosal immunity). We even looked at samples from patients with follicular lymphoma, a type of blood cancer that affects lymphoid tissue, to see how the immune neighborhood changes in disease. For each tissue type, we analyzed samples from multiple patients, giving us a robust dataset.
To identify the different ILC and Th subsets, we designed specific panels of markers. It’s a bit like giving each cell type a unique barcode based on the proteins they express. We had to be careful because ILCs can be a bit shifty, changing their look depending on where they are and what’s going on. We also made sure to exclude other cell types like B cells and conventional T cells so we were really focusing on the ILCs and Th cells. We even adjusted our approach for the thymus, including a marker (TdT) to distinguish immature T cells from ILCs, which turned out to be pretty insightful.
Where Cells Call Home
Okay, so what did we find when we mapped everything out? Turns out, where ILCs live is definitely not random; it’s very tissue-specific.
In the **thymus**, which is like a school for T cells, we saw a lot of immature T cells hanging out in the outer part (cortex), which makes sense as that’s where they start their training. Mature T cells were more in the inner part (medulla). Interestingly, ILC2s were the most common ILC type here and they preferred the medulla, too. But here’s something unexpected: we found that some immature T cells in the cortex, even before they had fully formed their T cell receptors, already showed signs of leaning towards a Th2 or Th17 identity. It’s like they were showing hints of their future career path really early on!
The **spleen** was quite different. While other ILCs were present, the spleen was dominated by NK cells (a type of ILC1). They were found throughout, but especially in the red pulp area. Other ILC types were much less common here.
Moving to the gut-associated tissues, the **appendix** and **ileum**, we saw a different pattern. Here, ILC1 and ILC3 were the most abundant ILC types, particularly in the areas outside the lymphoid follicles (the mucosal tissue). ILC2s were less common but were better at getting into the follicles. This makes sense because the gut lining needs constant immune surveillance, and ILC1s and ILC3s are key players in defending those barriers.
In **lymph nodes** and **tonsils**, ILC2s were the most prominent ILC type. They were found both inside and outside the lymphoid follicles, and notably, they were quite good at penetrating into the follicles themselves. This is interesting because follicles are where B cells hang out and make antibodies, and it suggests ILC2s might be influencing that process. ILC1s and ILC3s were mostly found outside the follicles in these tissues.
We also found a significant pool of ILCs that didn’t seem to fit neatly into the classic ILC1, 2, or 3 boxes based on our markers. These “undifferentiated” ILCs might be like a local reserve, ready to specialize depending on what the tissue needs. Our flow cytometry validation in tonsil confirmed that our histological method was accurately identifying the main ILC subsets and also hinted at the presence of these potential precursor cells.
The Buddy System
One of the coolest parts of this study was looking at who was hanging out with whom. We used spatial analysis to see how close ILCs were to their T helper counterparts. And guess what? They totally have a buddy system!
Across all the tissues we looked at, ILCs were often found in close proximity to their corresponding T helper cells. ILC1s were frequently near Th1s, ILC2s near Th2s, and ILC3s near Th17s. This isn’t just a coincidence; it strongly suggests that these pairs are interacting and influencing each other. Think of it like different teams in the immune system working together, often side-by-side.
In the thymus, for example, we saw ILC2s hanging out closely with Th2s, but also with Th1s and Th17s, suggesting they might play a broader role in shaping T cell development there. In the spleen, where NK/ILC1ie and ILC1s were abundant (especially in the red pulp of our samples, which were from traumatic injuries), they were found right next to Th1s. This fits with their roles in initial injury response and coordinating with adaptive immunity. In the gut tissues (appendix and ileum), Th2s were often close to ILC2s, supporting the idea of coordinated type 2 immunity at mucosal barriers. But interestingly, Th2s were also found near ILC1s and ILC3s there, suggesting a complex interplay.
This close proximity really highlights the importance of the tissue microenvironment. These cells aren’t just floating around; they’re strategically positioned to interact with each other and with the surrounding tissue cells (like epithelial cells, fibroblasts, and blood vessels), receiving signals and sending them out to coordinate immune responses.
When Things Go Wrong: Follicular Lymphoma
To see how this immune landscape changes in disease, we applied our mapping tool to follicular lymphoma (FL) samples. And wow, things were definitely different compared to healthy lymph nodes and tonsils!
In FL, we saw a significant drop in the overall pool of ILCs (the IL-7Rα+ cells) compared to healthy lymph nodes. Specifically, ILC2 and ILC3 populations were significantly reduced. It’s like the lymphoma disrupts the normal balance of these innate immune cells.
However, while ILC1 density didn’t change much overall, they seemed to relocate, moving into and around the cancerous follicles. Even more striking, NK/ILC1ie cells, which were pretty rare in healthy lymph nodes and tonsils, showed up more frequently in the neoplastic follicles of FL. ILC2s also still managed to get into the follicles in FL, though their overall numbers were down.
The T cell picture also changed. While the total number of T cells wasn’t drastically different, there was a noticeable shift in the T helper balance within the lymphoma microenvironment. Th2 cells seemed relatively stable or slightly increased, but Th17s decreased significantly, and Th1s increased, especially within the tumor follicles.
So, in FL, you have a reduced ILC population (especially ILC2s and ILC3s), a relocation of ILC1s and NK/ILC1ies into the tumor follicles, and a shift in the T helper landscape towards Th1. This deep perturbation of the immune cell neighborhood in lymphoma really underscores how the tumor can mess with the local immune system.

Why This Matters
Before this study, our understanding of where exactly ILCs sit in human tissues was mostly based on methods that didn’t give us this detailed spatial context. We knew they were important, but seeing their precise location and who they’re interacting with at a single-cell level across whole tissues is a big step forward.
This spatial mapping tool, using relatively standard lab techniques combined with advanced imaging and analysis, is faster and more cost-effective than some of the super high-tech methods out there. It allows us to study the immune landscape in a way that’s compatible with routine pathology labs.
The findings themselves are super valuable. We’ve created detailed maps for various healthy lymphoid tissues, confirming some previous ideas and revealing new insights, like the early Th-like profiles in immature thymocytes or the specific distribution patterns in the appendix. We’ve also shown how this landscape is dramatically altered in follicular lymphoma.
Understanding the precise location and interactions of ILCs and T helper cells in both health and disease is crucial. It helps us figure out how the immune system maintains balance, how it responds to threats, and how diseases like cancer manage to evade or manipulate it. This spatial information could be key to developing new diagnostic markers or therapeutic strategies. For instance, the specific patterns of ILC distribution and their proximity to other cells could potentially serve as biomarkers to predict disease progression or response to treatment.
In summary, we’ve managed to create a high-resolution, spatial map of ILCs and T helper cells in human lymphoid tissues and lymphoma. It’s like giving immunologists a detailed GPS for the immune system, showing us not just who’s there, but exactly where they are and who their neighbors are. This “Innate Lymphoid Index” (ILIx), as we’re calling it, is a promising new tool that could really help us understand and tackle immune-related diseases in the future.
Source: Springer