Liver’s Double Trouble: Unpacking Hepatitis B and Fatty Liver Disease with Proteomics
Hey there, science enthusiasts! Ever wondered what happens when two rather unwelcome guests decide to party in your liver at the same time? I’m talking about chronic hepatitis B (CHB) and non-alcoholic fatty liver disease (NAFLD). Both are a big deal on their own, potentially leading to serious stuff like liver fibrosis and even cancer. But when they team up? Well, that’s what we’ve been digging into, and let me tell you, it’s a complex story written in the language of proteins!
The Growing Concern: When CHB Meets NAFLD
So, here’s the scoop. CHB, caused by the hepatitis B virus (HBV), is a global health headache, affecting millions. And NAFLD? Its numbers are skyrocketing right alongside rising obesity and metabolic syndrome rates. It’s basically when your liver starts hoarding fat, and not in a good way. It’s estimated that nearly a third of folks with CHB also have NAFLD. Yikes! That’s a lot of livers under double stress.
Now, the interesting bit is that the science world has been buzzing with questions about how these two diseases interact. Does one make the other worse? Or, oddly enough, could there be some unexpected effects? Some studies hint that NAFLD might actually be linked to lower HBV markers in CHB patients. Confusing, right? That’s why we decided to roll up our sleeves and get a closer look at the protein level – the real workhorses of our cells.
Our Mission: A Deep Dive into Liver Proteins
Our goal was pretty ambitious: we wanted to see exactly what changes happen to the protein landscape in the liver when CHB and NAFLD are present, both separately and together. We got our hands on actual liver tissue samples from four groups of people: healthy individuals (our baseline), patients with CHB only, patients with NAFLD only, and patients dealing with both CHB and NAFLD. It’s like comparing different crime scenes to see who the culprits are and how they operate!
We used a super cool technique called proteomic profiling – specifically, data-independent acquisition (DIA) mass spectrometry. Think of it as a highly sophisticated way to identify and count thousands of different proteins in a tiny piece of tissue. Once we had this massive list of proteins, we used bioinformatics tools (like GO and KEGG pathway analysis) to figure out what these protein changes actually mean for the liver’s health and function. And to make sure we weren’t just seeing things, we even verified some of our key findings in mouse models. Talk about thorough!
What Did We Find? The Protein Plot Thickens!
Alright, let’s get to the juicy bits. When we compared the liver proteins across our groups, some fascinating patterns emerged.
First off, in patients who had both CHB and NAFLD, it looked like their bodies might be doing a better job at clearing the hepatitis B virus. This enhanced viral clearance seemed to be linked to an inflammatory response and the activation of a whole bunch of metabolic pathways. It’s like the body’s defense system gets an unexpected kickstart. For example, we saw lower levels of a protein called PGC-1α in the CHB+NAFLD group compared to those with CHB alone. Previous research suggests that lower PGC-1α can inhibit HBV replication. Pretty neat, huh?
When we looked at how fatty the liver was (hepatic steatosis), this was clearly tied to issues in how the liver breaks down fatty acids and manages sugar (glycolysis/gluconeogenesis). No big surprises there, but our protein data gave us a much more detailed map of these metabolic mix-ups.
The Not-So-Good News: A Tougher Prognosis?
However, it wasn’t all potentially good news. The prognosis for patients battling both CHB and NAFLD might actually be more severe. This seemed to be connected to altered levels of specific proteins. We’re talking about characters like ACAT1, ACY1, SERPINB3, MTCH2, ALDH2, ECHS1, S100A7, and LRP6. Each of these proteins has a role to play, and when their levels go haywire, it can spell trouble.
For instance, SERPINB3 levels tend to go up in chronic liver diseases and even liver cancer. We saw higher levels of SERPINB3 in the CHB+NAFLD group compared to the CHB-only group. Similarly, S100A7, linked to the IL-17 signaling pathway (which is involved in inflammation), was also higher. High S100A7 expression has been associated with various tumors. These findings suggest that when fatty liver joins the CHB party, it might activate pathways that could unfortunately lead to a poorer outcome.
Compared to having just CHB or just NAFLD, the combination seems to create a unique and potentially less favorable protein signature in the liver. It’s like the two diseases together create a new kind of storm.
Decoding the Differences: CHB vs. CHB+NAFLD
When we specifically compared patients with CHB to those with CHB plus NAFLD, we found 109 proteins that were differentially expressed. Many of these were involved in processes like keratinocyte differentiation and homocysteine metabolism. Interestingly, some metabolic pathways that were abnormally active in CHB alone (like glycine, serine, and threonine metabolism) actually got inhibited when NAFLD was also present. This was linked to decreases in proteins like CBS and PSAT1. It’s a real metabolic tug-of-war!
On the flip side, the IL-17 signaling pathway, which can promote an immune response, was activated in the CHB+NAFLD group, mainly due to increased S100A7. This could be a double-edged sword – helping with viral clearance but also potentially driving inflammation and worse outcomes. We also saw that the hepatocellular carcinoma (HCC) pathway seemed to be suppressed in the CHB+NAFLD group compared to CHB alone, linked to higher LRP6 expression. That’s a complex finding that needs more unpacking!
Decoding the Differences: NAFLD vs. CHB+NAFLD
Now, what happens when you compare NAFLD-only patients to those with both NAFLD and CHB? We found a whopping 221 differentially expressed proteins! Many pathways that were revved up in NAFLD alone seemed to get dampened when HBV infection joined the picture. This included big players like:
- Fatty acid degradation
- Glycolysis/gluconeogenesis
- The PPAR signaling pathway (super important for fat metabolism)
- Fat digestion and absorption
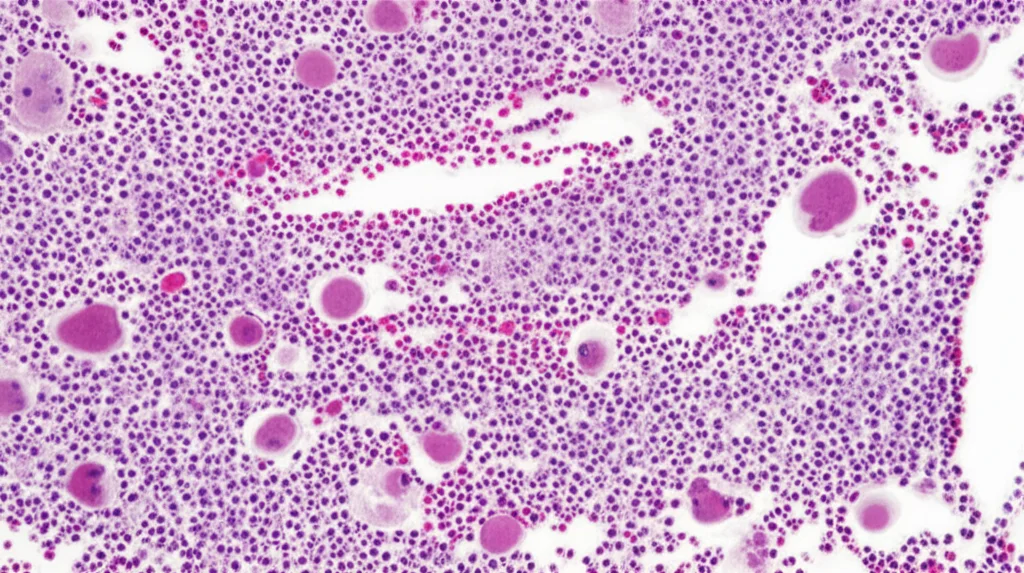
Key proteins responsible for these shifts included ACADM, ECHS1, ACAT1, EHHADH, and ALDH2. Our follow-up tests (immunohistochemistry, or IHC, which is like staining proteins in tissue slices to see them) confirmed that ECHS1, ACAT1, and ALDH2 levels indeed dropped when both diseases were present. This suggests that HBV infection significantly messes with the metabolic chaos already stirred up by NAFLD.

Mouse Models: Confirming Our Suspicions
To take our findings beyond human samples, we turned to our furry friends – mice! We created mouse models for HBV, NAFLD, and NAFLD combined with HBV. What we saw in these mice mirrored some of our human data. For example, the NAFLD+HBV mice had less severe fatty liver signs (like smaller liver cells and fewer fat droplets) compared to NAFLD-only mice. Their body weight was also lower.
Interestingly, serum levels of HBV markers (HBsAg, HBeAg, and HBV-DNA) significantly decreased in the NAFLD+HBV mice after 12 weeks on a high-fat diet compared to mice with just HBV. This again hints at NAFLD potentially influencing HBV clearance. However, liver injury markers (ALT, AST) and triglycerides/cholesterol were higher in the NAFLD+HBV group than in the NAFLD-only group, suggesting more overall liver stress despite better viral control.
So, What Does This All Mean?
Phew! That was a lot of protein talk. But what’s the big takeaway? Well, our study paints a really detailed picture of the molecular drama unfolding in the liver when CHB and NAFLD coexist. It seems that having NAFLD might, in some ways, help the body fight off the hepatitis B virus, possibly through inflammatory responses and shifting metabolic gears. We saw this with changes in PGC-1α and certain metabolic pathways.
However, this isn’t a simple “good news” story. The combination of CHB and NAFLD also seems to trigger changes in other proteins (like SERPINB3 and S100A7) that could point towards a more severe disease course and a poorer long-term outlook. The way the liver handles fats and sugars gets seriously disrupted, and inflammatory signals can get amplified.
Essentially, the interaction is a complex dance. While NAFLD might throw a wrench in HBV’s plans, the combined effect on the liver could still be quite damaging, possibly accelerating the journey towards more serious conditions like cirrhosis or even liver cancer. The distinct protein patterns we observed in the CHB+NAFLD group are crucial clues.
Limitations and Looking Ahead
Of course, no study is perfect. Our sample sizes were relatively small, so these findings need to be validated in larger groups of patients. Also, while we’ve identified these protein changes, digging into the exact “how” and “why” – the deep molecular mechanisms – will require more research. Sometimes protein levels and their corresponding gene activity (mRNA levels) don’t perfectly match, and there can be differences between human patients and mouse models, so there’s always more to explore.
But, I’m really excited because this work provides some fresh ideas for understanding how these two very common liver diseases develop and, more importantly, how they talk to each other. By pinpointing these specific protein changes, we’re hopefully paving the way for better diagnostic tools and maybe even new treatment strategies for patients who are unfortunately dealing with this double whammy.
It’s all about understanding the enemy (or in this case, enemies!) to better fight them. And looking at the protein level gives us an incredibly powerful lens to do just that!
Source: Springer