India’s Older Women: The Health Paradox of Living Longer with More Disability
Hey there! Let’s talk about something fascinating, and honestly, a bit of a head-scratcher when it comes to health and aging, especially in a place as diverse as India. We often hear that people are living longer these days, which is fantastic news! But here’s the twist: are those extra years spent living *well*? And does it play out the same way for everyone, particularly between men and women?
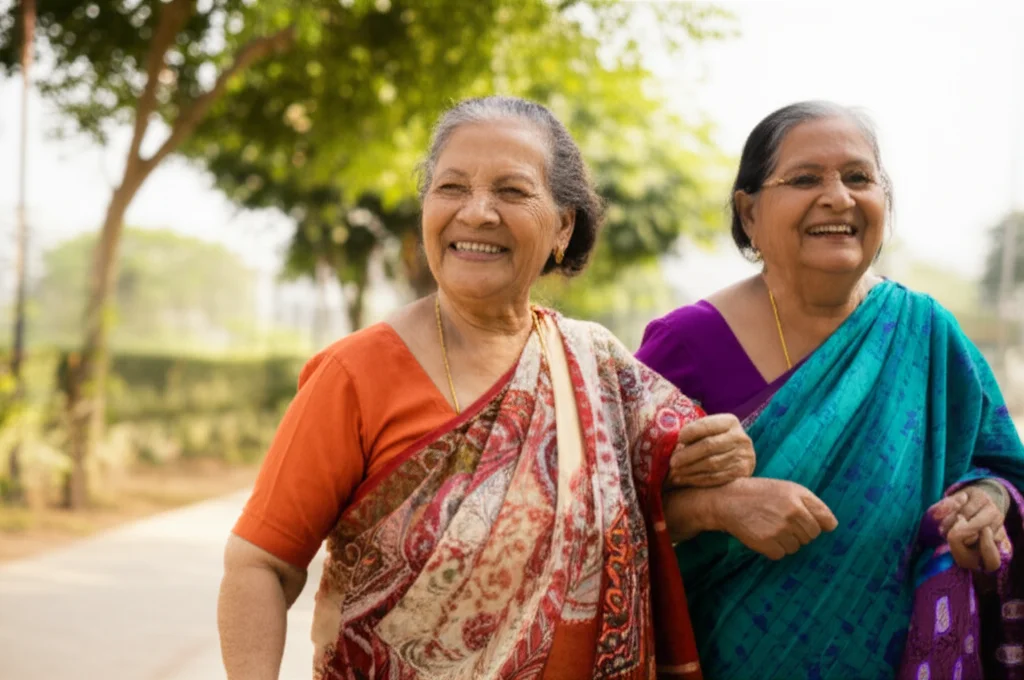
Our dive into the data from India reveals a complex picture, particularly for older adults aged 60 and above. It seems that while women in India are indeed living longer than men – a trend we see globally – they might be spending a larger chunk of that extended life dealing with health issues and disabilities. This is what researchers call the **morbidity-mortality paradox**, and it’s a pretty big deal.
Understanding the Paradox
So, what exactly is this paradox we’re talking about? Simply put, it’s the phenomenon where one group (in this case, females) lives longer than another (males), enjoying a **mortality advantage**, but simultaneously experiences more illness, chronic conditions, and disability – a **disability disadvantage**. It feels counter-intuitive, right? You’d think living longer would mean living *healthier*, but that’s not always the case. This puzzle has been observed in many places around the world and goes by a few names, like the ‘male-female health-survival paradox’ or the ‘gender and health paradox’.
The Indian Picture
India has made huge strides in reducing mortality rates over the past few decades, leading to longer life expectancies for everyone. Back in the 1970s, men actually lived slightly longer than women in India. Fast forward to today, and that’s completely flipped. Women now outlive men, with a life expectancy at birth that’s a few years higher. For those aged 60, women nationally can expect to live about 19.2 more years, compared to 17.4 years for men. That’s a solid 1.8-year mortality advantage for women right there.
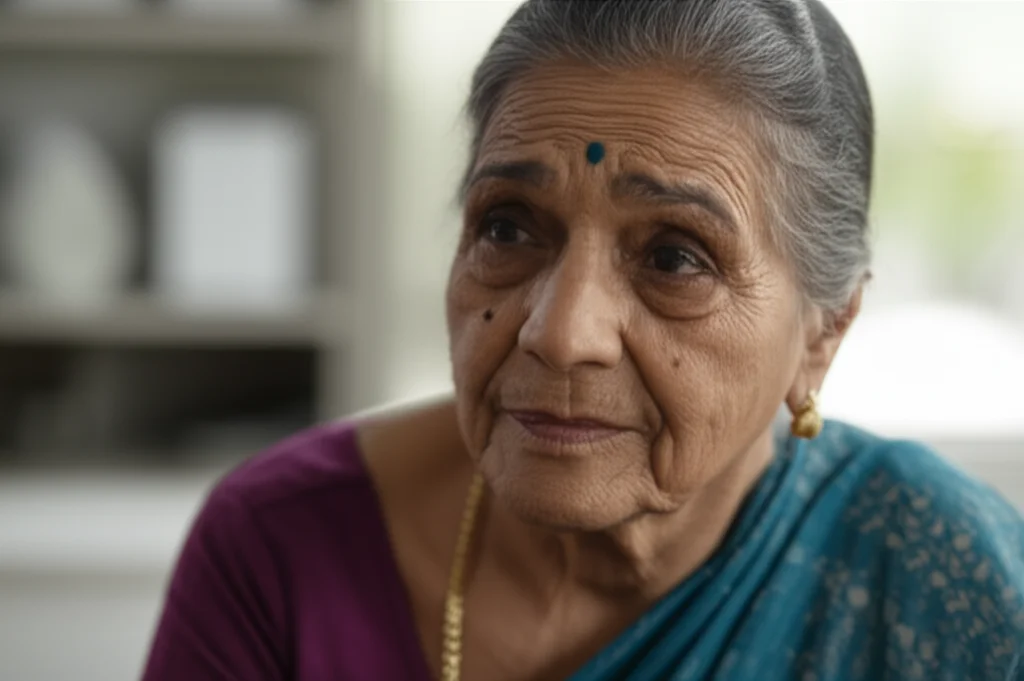
But here’s where the paradox bites: despite this survival edge, studies consistently show that older women in India tend to report poorer health across various measures. We’re talking about things like:
- Lower cognitive health
- Weaker handgrip strength
- Higher rates of depression and noncommunicable diseases
- More functional limitations
This raises a crucial question: is this longer life for women truly translating into better quality of life, or are those extra years spent struggling with poor health?
Measuring Health Beyond Lifespan
Just looking at how long someone lives (Life Expectancy or LE) doesn’t tell the whole story about their health status. To really understand the *quality* of those years, we need better tools. This is where the concept of **Healthy Life Expectancy** comes in. It’s a clever way to combine information about how long people live with information about their health status (like disability or morbidity).
Two key measures help us here:
- Disability-Free Life Expectancy (DFLE): This is the average number of years a person can expect to live in good health, without significant activity limitations, from a certain age onwards.
- Disability Life Expectancy (DLE): This is the average number of years a person can expect to live in poor health, with disability, from a certain age onwards.
By breaking down total LE into these two components, DFLE and DLE, we get a much clearer picture of whether those extra years are spent healthy or with disability.
What the Study Did
To get to the bottom of this paradox in India, our study used some solid data sources. We looked at age-specific death rates from India’s Sample Registration System (SRS), which is a widely respected source for mortality data. For disability information, we turned to the Longitudinal Ageing Survey in India (LASI), a massive survey that gathers detailed health and well-being data from older adults across the country.
Using established methods (Greville’s for life tables, Sullivan’s for healthy life expectancy), we estimated LE, DFLE, and DLE for men and women aged 60 and above, both nationally and for 22 major states. We then calculated the sex gaps (female minus male) for each measure. Finally, and this is key, we used a decomposition method to figure out how much of the sex gap in healthy life years (DFLE and DLE) was due to differences in mortality versus differences in disability rates. Think of it like unpacking a suitcase to see what’s inside – we wanted to see which factor (living longer or having more disability) contributed more to the health gap.
The Big Reveal: National Findings
So, what did we find when we crunched the numbers for India as a whole?

At age 60, we confirmed the mortality advantage for women: they live about 1.8 years longer than men. However, when we looked at disability prevalence, it was higher among women nationally.
Now, let’s look at the healthy life years:
- The sex gap in DFLE (healthy years) at age 60 was tiny – just 0.03 years, barely any difference!
- The sex gap in DLE (years with disability) at age 60 was a whopping 1.77 years, with women living significantly *more* years with disability than men.
This is where the paradox becomes stark. Women live 1.8 years longer, and almost all of that extra time (a staggering 98%!) is spent in a state of disability. This strongly supports the existence of the morbidity-mortality paradox at the national level in India. It suggests that while women are surviving longer, they aren’t necessarily thriving in those extra years.
State-by-State Differences
India isn’t a single entity; it’s a collection of incredibly diverse states, each with its own health profile, socio-economic conditions, and cultural nuances. So, it’s no surprise that the picture varies quite a bit from state to state.
The sex gap in total LE at age 60 ranged dramatically, from a high of 5.1 years favoring women in Jammu e Kashmir to actually favoring men by 1.1 years in Jharkhand.
Crucially, disability prevalence was higher among women compared to men in *every single state* we looked at. The size of this gap varied, but the pattern was consistent.
When we looked at the percentage of total LE spent in disability, it was higher for women than men in almost all states (Odisha was a slight exception). In West Bengal, for instance, older women spent 47.8% of their expected remaining life with disability, compared to 34.4% for men. That’s a big difference!
Looking at the *additional* years women gained through their mortality advantage, the picture is even clearer. Nationally, as we saw, 98% of those extra years were spent in disability. This pattern held true for most states. In Uttar Pradesh, for example, 92.9% of women’s additional years were spent with disability. Some states, like Maharashtra, Assam, and West Bengal, showed that the time women spent in disability was actually *more* than their total mortality advantage!
However, there were a few exceptions where the paradox was less pronounced or didn’t apply based on this second metric: Rajasthan, Odisha, Haryana, and Karnataka. In Rajasthan, only about 9.2% of women’s additional years were spent in disability – a much more favorable outcome.
Breaking down the sex gap in healthy years (DFLE) by age group showed something interesting: the contribution of mortality differences to the gap decreases as people get older, while the contribution of disability differences tends to increase. This suggests that while surviving longer is key in younger older ages, managing disability becomes more critical in shaping health disparities in the oldest age groups.
Why is This Happening? Exploring the Reasons
So, why this paradox? Why do women live longer but face more years with disability? It’s likely a complex mix of factors, both biological and social.

Biologically, women might have an edge in longevity due to genetics (like the XX chromosome). However, hormonal changes, particularly after menopause, can increase their risk for certain chronic conditions like heart disease and bone issues later in life. Men, on the other hand, might be more susceptible to fatal conditions earlier due to factors like testosterone effects on the immune system or different disease patterns (e.g., more fatal heart disease, lung cancer, road injuries).
Social factors also play a significant role. Gender roles often mean women spend more time indoors, potentially exposing them to higher levels of indoor air pollution from cooking fuels, which can contribute to chronic respiratory and other health problems. Men, conversely, might engage in more risky behaviors like smoking, drinking, or unsafe driving, leading to higher rates of fatal accidents and diseases earlier in life.
There’s also the aspect of health-seeking behavior and reporting. Some research suggests that men might be less likely to report illness or seek care due to social norms or stigma, while women might be more open about their health issues. This could potentially influence self-reported disability data.
Finally, the health profile of a region matters. States further along in the “epidemiological transition” (meaning they’ve shifted from infectious diseases being the main cause of death to chronic, noncommunicable diseases like diabetes and heart disease) might see higher rates of disability as people live longer with these conditions. This could explain some of the state-level variations we observed. For example, states with higher levels of NCDs like diabetes and neurological disorders among women showed a stronger paradox.
What Does This Mean for Policy?
Our findings have some pretty clear implications for how we think about and address the health of older adults in India.
First, relying solely on Life Expectancy as a measure of population health just doesn’t cut it. We need to regularly monitor and report on measures like DFLE and DLE to understand the *quality* of life in those later years and the true burden of disability.
Second, there’s a clear and urgent need to focus on reducing disability among older women. Since they are living longer but spending a disproportionate amount of that time with health limitations, interventions are needed to improve their health status and functional independence.

Third, because the picture varies so much across states, policies and interventions need to be tailored to local contexts. States where the paradox is particularly strong (like West Bengal, Maharashtra, or Uttar Pradesh) might need different approaches compared to states where it’s less pronounced (like Rajasthan or Odisha). This could involve targeted programs to address specific chronic diseases prevalent among older women in those regions, improve access to rehabilitative services, or address social determinants of health like indoor air pollution exposure.
Addressing these disparities isn’t just about health; it ties directly into broader development goals, like achieving gender equality, reducing overall inequality, and ensuring health and well-being for everyone at all ages.
In wrapping up, while India celebrates increasing longevity, our study highlights that the story is more complex, especially for older women. The morbidity-mortality paradox is a reality, meaning many women are living longer, but with a significant burden of disability. By focusing on healthy life years (DFLE and DLE) and implementing state-specific strategies, we can work towards a future where living longer truly means living healthier and with a better quality of life for all older Indians.
Source: Springer


