The Hidden Hand in the Sky: How Jet Streams Unleashed India’s Extreme Floods
Hey there! Let’s talk about something wild that happens way up in the atmosphere and how it can cause absolute chaos down here on Earth. Specifically, I want to dive into a recent study that sheds some fascinating new light on those terrifying, record-breaking floods that hit North India in June 2013 and again, almost exactly a decade later, in July 2023.
You know, India’s North Indian Subcontinent (NIS), especially near the Himalayas, is no stranger to heavy monsoon rain. It’s part of life, crucial for farming, but sometimes it goes terribly wrong. And when it does, it’s not just inconvenient; it’s devastating. The Himalayan foothills are particularly vulnerable, prone to floods, landslides, and all sorts of related hazards.
The Devastation: Two Unforgettable Events
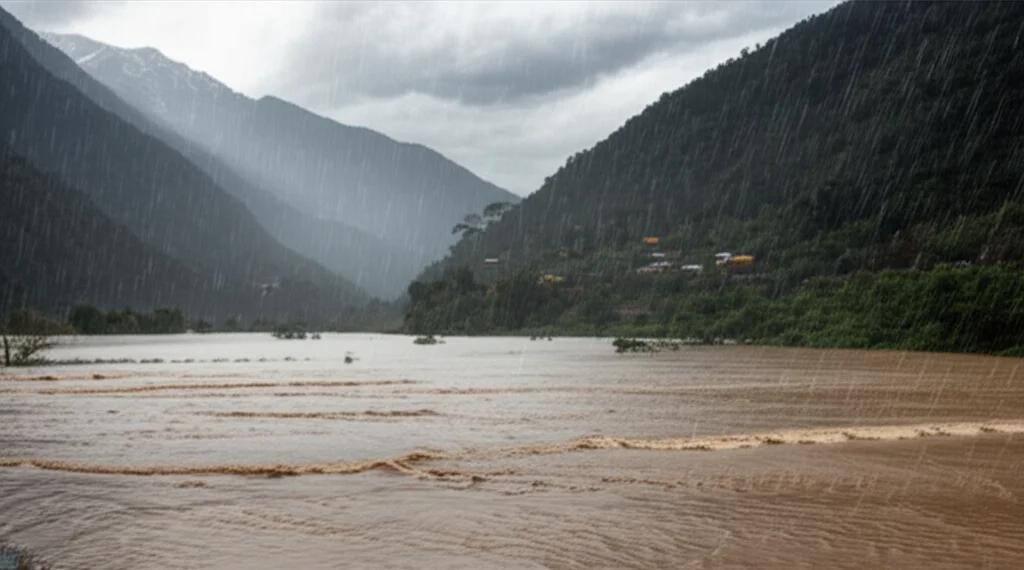
Let’s rewind a bit. Remember June 13–19, 2013? Uttarakhand state got absolutely hammered. The India Meteorological Department (IMD) reported a staggering 322 mm of rain in just that week. Now, compare that to the usual average for that week, which is about 34 mm. We’re talking an 847% departure from the norm! This wasn’t just rain; it was a deluge that led to catastrophic floods, impacting around 100,000 people and tragically claiming over 500 lives. Forests were wiped out, livestock lost – a truly heartbreaking event.
Fast forward ten years to July 7–11, 2023. This time, it was Himachal Pradesh, another state in the same region. In just four days, they saw an unprecedented 223 mm of rain. The climatological average for that period? A mere 41.6 mm. That’s a 436% deviation! Rivers overflowed, roads were blocked, landslides were rampant. More lives were lost, and property damage ran into the millions.
These weren’t just bad weather days; they were extreme events with immense consequences. And naturally, scientists want to understand *why* they happened.
The Usual Suspects: Monsoon Dynamics
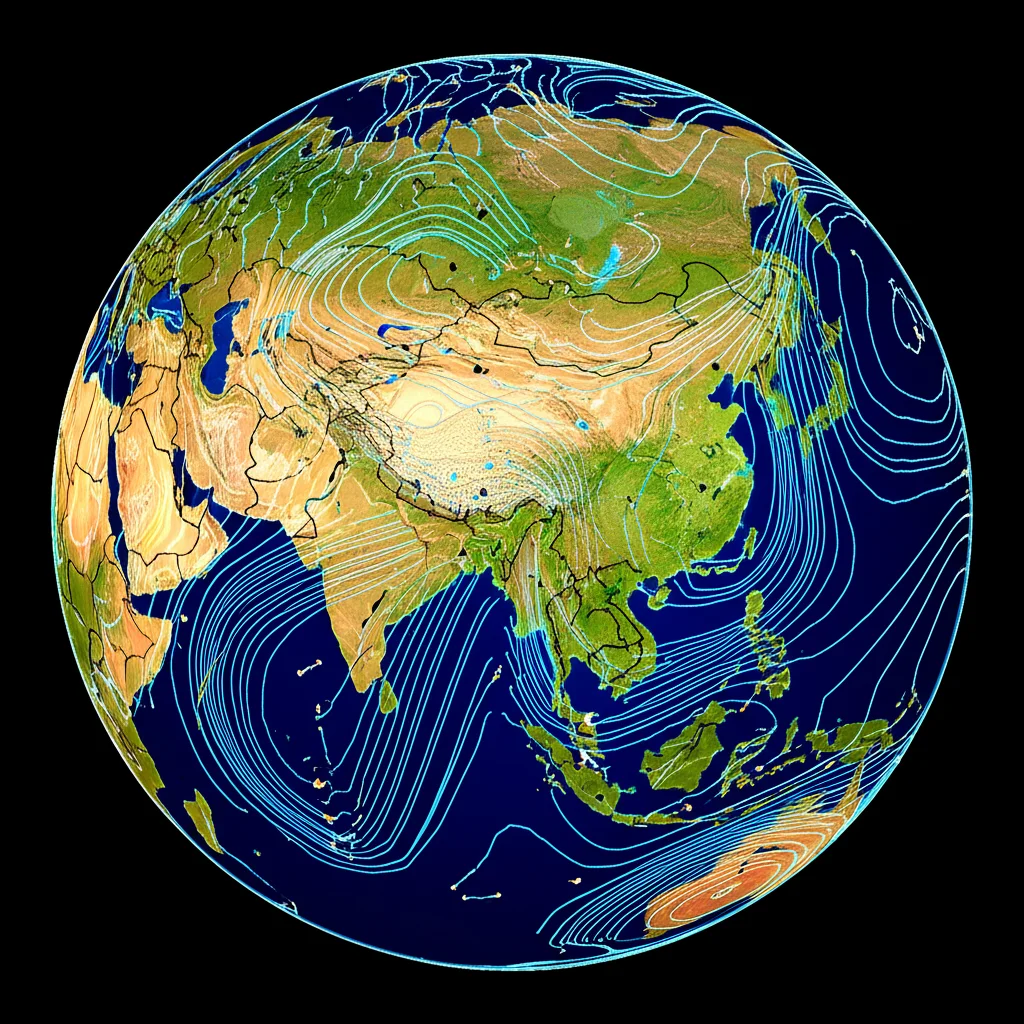
For a long time, we’ve known that extreme monsoon rainfall in this region is often linked to the complex dance between the typical monsoon systems (like the monsoon trough, low-pressure systems) and influences from higher latitudes – what we call extratropical circulations. Think of things like troughs in the subtropical jet stream or Rossby waves breaking.
These interactions can create conditions ripe for heavy rain. For instance, a trough dipping south from the mid-latitudes can cause air to diverge (spread out) high up in the atmosphere. When air diverges up high, it forces air from below to rise rapidly to fill the space. This rising air, if it’s loaded with moisture, cools, condenses, and boom – you get heavy precipitation. The steep slopes of the Himalayas only amplify this effect through orographic lift, forcing that moist air up even faster.
Previous studies looked at these events and pointed to things like monsoon low-pressure systems moving inland (for 2013) or the monsoon trough shifting (for 2023), combined with that upper-level divergence caused by subtropical jet intrusions. But there were still pieces missing. Where exactly did the air causing that divergence come from? And perhaps even more crucially, where did all that water vapor originate?

Unveiling the Jet Stream Connection: A New Piece of the Puzzle
This new study, using some pretty sophisticated tools, dug deeper. And guess what they found? A critical player that hadn’t been fully appreciated before: the subpolar jet stream. It turns out that the southward movement of the *subpolar* jet stream seems to be linked to the creation of that crucial trough in the *subtropical* jet stream. Think of the subpolar jet giving the subtropical jet a nudge or creating conditions that make it buckle southwards.
This interaction, happening far to the west of the flood region, sets off a chain reaction. The trough in the subtropical jet stream causes that upper-level divergence – the spreading out of air high up – specifically over the North Indian Subcontinent. And as we know, that divergence is key to driving the intense upward motion needed for extreme rainfall.
They looked at the wind patterns high up (around 200 hPa pressure level) for both events. Before the peak rain in 2013 (from June 13th onwards) and 2023 (from July 4th onwards), they saw this pattern: a trough forming in the subtropical jet stream to the west of the flood area, moving southward, and leading to increased divergence right over the NIS region. The timing matched the increase in rainfall perfectly. This strengthens the idea that this upper-level divergence, triggered by the jet stream dynamics, is a common thread.
Tracing the Air: A Tale of Two Floods
To really understand this, the researchers used a cool technique called Lagrangian parcel tracing with a model called TRACMASS. Instead of just looking at snapshots of wind (Eulerian view), this method lets you track “parcels” of air or water backward or forward in time. It’s like putting a tiny GPS tracker on bits of the atmosphere and seeing where they’ve been or where they’re going.
Using this, they traced the air that was causing that upper-level divergence over the flood region backward in time. And here’s where the two events showed interesting differences:
- For the June 2013 flood, the northward-moving air contributing to the divergence mostly came from the upper-level westerlies (winds blowing from west to east). Air from the Bay of Bengal and Arabian Sea also seemed to feed into this, merging with the mid-latitude winds.
- For the July 2023 flood, the story was different. The air pathways were more dominant over the Indo-Gangetic plains, suggesting a bigger contribution from easterly winds (winds blowing from east to west). What’s more, air originating from the lower levels over the Arabian Sea and western Indian Ocean was found to be ascending to higher levels and merging with these upper-level easterlies. The subtropical westerlies played a less dominant role this time.
So, while both events featured upper-level divergence linked to the subtropical jet, the *source* and *pathway* of the air creating that divergence differed.
Where Did the Water Come From?
Understanding where the air comes from is one thing, but where did all that *water* come from? The Lagrangian tracing model can also trace the moisture back to its source – essentially, where it evaporated from days or weeks earlier.
Again, there were some key similarities and differences:
- In both cases, local evaporation (water evaporating from the ground, rivers, etc., within or near the flood region) played a role.
- For the June 2013 event, the main oceanic sources were a narrow channel in the western Indian Ocean and the Persian Gulf. Interestingly, *in-land* evaporative sources were quite significant, particularly from eastern peninsular India. The researchers speculate this might have been water that fell as rain a few days earlier and then re-evaporated, contributing to the extreme event.
- For the July 2023 event, the oceanic sources were different. They originated from two channels south of 20°S, one near Madagascar. These sources fed into the lower-level monsoon flow over the western Indian Ocean. The contribution from in-land evaporation was comparatively less than in 2013.
And the Bay of Bengal? Despite being a major part of the monsoon system, the study found it acted primarily as a transport pathway for moisture in both events, rather than a direct source of evaporation for the extreme rainfall itself. Moisture traveled *across* it, but didn’t necessarily *come from* evaporation happening there right before the floods.

Why This Matters for Forecasting
So, why go through all this detailed tracing? Because understanding the *specific* mechanisms and the *origins* of the air and water is crucial for improving weather forecasting, especially for extreme events.
Knowing that the interaction between the subpolar and subtropical jet streams is a key precursor, and that this interaction happens days before the floods, gives forecasters a potential early warning signal. Identifying the specific upstream moisture sources (like those near Madagascar or in the western Indian Ocean weeks in advance) also adds valuable lead time.
The Lagrangian tracing method used in this study is particularly powerful because it tracks the *mass* of air and water, and it can trace backward precisely. The researchers suggest that running models like TRACMASS operationally alongside standard weather forecast models could provide detailed insights into where the moisture is coming from, its pathway, and how long it’s been in the atmosphere – all critical information for predicting heavy rainfall events days or even weeks out.
Still More to Explore
While this study reveals a significant new piece of the puzzle – the critical role of the subpolar jet stream interaction – the scientists are quick to point out that there are still open questions. They want to investigate the exact dynamics of how the subpolar jet influences the subtropical jet, whether phenomena like Rossby wave breaking are always involved, why the moisture sources were so different between the two events, and how sensitive North Indian floods are to the exact position of the subpolar jet.
Extending this type of detailed Lagrangian analysis to more flood events could help confirm if this subpolar-subtropical jet interaction is a robust, predictable pattern.
In conclusion, it’s pretty clear that those devastating floods in 2013 and 2023 weren’t just random acts of nature. They were the result of complex atmospheric dynamics, including a previously under-emphasized interaction between the subpolar and subtropical jet streams high above us, combined with specific pathways and sources of moisture originating far away, sometimes weeks in advance. Unraveling these connections is a vital step towards better preparing for and mitigating the impact of future extreme rainfall events in this vulnerable region.
Source: Springer