
Decoding Fractured Gas Wells: A Shut-In Story
Hey there! Let’s dive into something pretty cool and super important in the world of getting gas out of the ground, especially from those tricky, low-porosity spots. You know, the ones where the gas is just kinda… stuck. We’re talking about fractured gas reservoirs and how we can learn a ton about them just by turning the pumps off for a bit. Sounds counter-intuitive, right? But stick with me, it’s fascinating.
Getting energy these days is a big deal, and we’re increasingly looking at unconventional resources. These fractured low-porosity gas reservoirs are a huge part of that picture globally. The problem is, the rock itself doesn’t let gas flow easily. So, what do we do? We hit it with hydraulic fracturing! It’s like giving the rock a high-pressure spa treatment to create pathways – a complex network of fractures – so the gas can actually move and we can get it out.
Now, doing the fracturing is one thing, but knowing *how well* you did it? That’s where the magic happens. And one of the best ways to figure that out is by analyzing what happens when you stop pumping and shut the well in. The pressure downhole starts to drop, and how it drops tells us a story about the fractures we just created. This is the shut-in pressure decline curve, and analyzing it is crucial for understanding if our fracturing job was a success.
The G-Function Challenge
For a long time, folks used something called the G-function to analyze this pressure decline. It’s a neat mathematical tool that relates pressure to time and helps estimate things like fluid efficiency and how much fluid is leaking out into the formation (the leak-off coefficient). It works okay for simpler situations, like conventional reservoirs where the rock is pretty uniform.
But here’s the rub: those low-porosity gas reservoirs we’re talking about? They often have *natural* fractures already in them. And when you do hydraulic fracturing, you don’t just create new fractures; you often connect with these existing natural ones. This makes the whole system way more complex. The traditional G-function, which often assumes a constant leak-off, just can’t handle this complexity accurately. It’s like trying to use a basic map to navigate a super-complicated city with hidden alleyways.
Researchers have been chipping away at this, trying to adapt the G-function. They’ve looked at how natural fractures opening affect things, how pressure influences leak-off, and even how residual fracture width plays a role. But a really accurate method for these *naturally fractured* low-porosity gas reservoirs has been a bit elusive.
A Smarter Approach for Complex Fractures
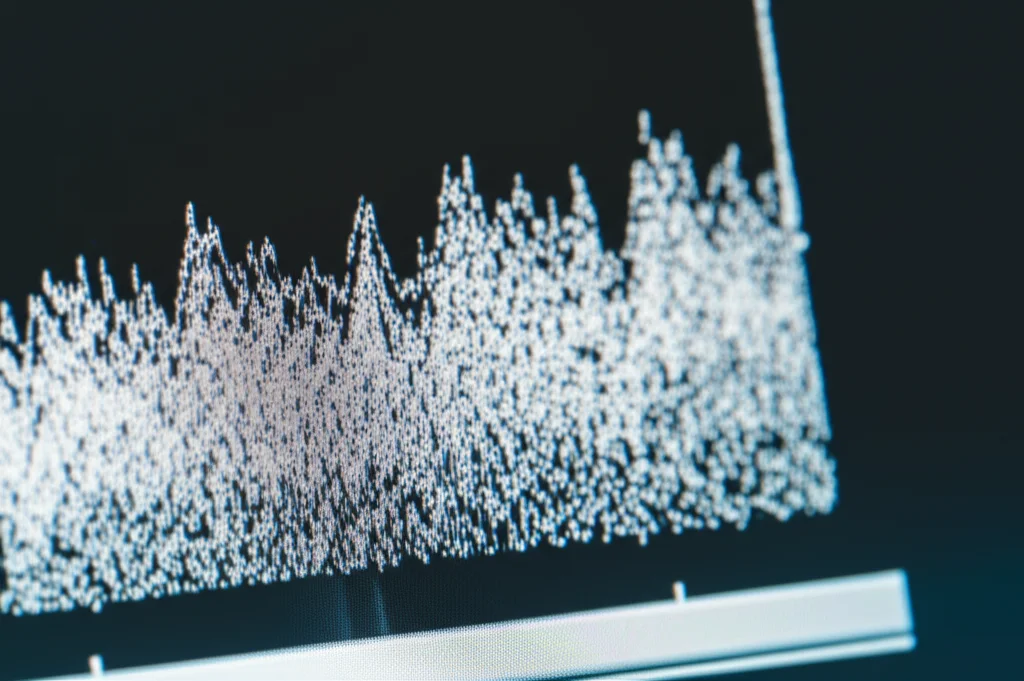
So, what’s the new game plan? This research dives deep into the shut-in curves of these complex reservoirs. The key insight is that the *fluctuations* in the pressure decline curve, especially when you look at the superposition derivative curve (which is basically a way to amplify those changes), tell you a lot about what’s happening with the natural fractures. When a natural fracture starts to close as the pressure drops, it changes the leak-off rate, and this shows up as a bump or wiggle on the curve.
Think of it like listening to a heartbeat. A steady beat is one thing, but little skips or changes in rhythm tell you something more is going on. In our case, those “humps” on the superposition derivative curve signal the closure of different sets of natural fractures. By segmenting the pressure decline curve based on these features, we can analyze each stage of fracture closure and get a better handle on parameters like the leak-off coefficient at different pressure levels.
This approach establishes a pressure drop model specifically for fractured low-porosity gas reservoirs that accounts for the *varying* leak-off coefficient as natural fractures close. It’s a much more realistic picture of what’s happening underground.

Characterizing Fracture Complexity
Beyond just analyzing leak-off, this method gives us a way to quantify how *complex* the fracture network is. You see, the more natural fractures that were connected during the fracturing process, the more “humps” you’ll see on that superposition derivative curve, and the more pronounced the fluctuations will be. This is a direct indicator of fracture complexity.
To put a number on this complexity, the research introduces something called an approximate series. This series is calculated using the leak-off coefficients determined for the different fracture closure stages. Essentially, it provides a single value that reflects the overall complexity of the fracture network created. A higher approximate series value means a more complex network, which, in theory, should lead to better gas production.
The paper outlines different characteristic shapes of the G-function curve observed in the field, linking them to different fracture scenarios:
- Conventional Leak-Off: Looks like the simple case, mostly matrix leak-off, few connected natural fractures.
- High Raised G-function: Very steep initial slope, then stable. Main fracture closes early on proppant, minimal natural fracture involvement.
- Raised G-function: Elevated initially, then straight. Natural/branch fractures close before the main one, leak-off coefficient decreases. Indicates good connection with natural fractures.
- Fluctuated G-function: Multiple rises and deviations. Multiple fracture closure events, representing the most complex network.
Identifying these patterns and analyzing the fluctuations is key to understanding the underground plumbing.
Taming the Noise
Okay, but analyzing these subtle pressure changes isn’t always easy because real-world data can be messy. Especially right after you shut down the pumps, you often get something called the water hammer effect – basically, pressure oscillations that look like noise on your data curve. This noise can totally mess up your analysis and make it hard to see those important fluctuations we just talked about.
So, a crucial part of this new approach is a sophisticated filtering method. It’s not just one filter; it’s a multi-stage process combining several techniques:
- Improved Hampel Filtering: This helps spot and remove weird spikes or outliers in the data.
- Optimized FIR Low-Pass Filtering: This smooths out high-frequency noise while keeping the important pressure changes.
- Enhanced Multi-Frequency Adaptive Notch-Median Filtering: This is designed to tackle those specific oscillations caused by the water hammer effect, adapting to different frequencies in the noise.
Putting these together creates a robust system to clean up the pressure data significantly, making the shut-in curves much clearer and the analysis much more accurate. It’s like putting on noise-canceling headphones so you can hear the subtle signals from the reservoir.
Real-World Proof
Does this fancy new method actually work? The researchers put it to the test using real data from wells in the Tarim Oilfield, specifically in the Bozi-Dabei block, which is known for its naturally fractured reservoirs. They analyzed the shut-in curves from several wells (let’s call them A, B, and C, like in the study) using this new approach.
First, they applied the comprehensive filtering to clean up the noisy pressure data. The results showed the filtering did a great job of removing the water hammer noise while preserving the actual pressure decline characteristics. Clean data is happy data!
Then, they analyzed the filtered shut-in curves, identified the fracture closure stages based on the superposition derivative “humps,” calculated the leak-off coefficients for each stage, and finally computed the approximate series value for each well.
What they found was super encouraging. Well A showed a certain level of complexity with its approximate series value. Well B, which had a more developed natural fracture network according to geological data, had a higher approximate series value and more pronounced fluctuations in its curve. Well C, with fewer natural fractures identified, had the lowest approximate series value and the smoothest pressure decline curve.
The ultimate test? How much gas these wells produced after fracturing. And guess what? The wells with higher approximate series values (indicating more complex fracture networks according to the analysis) had significantly higher production rates! Well B had the highest approximate series and the highest flow rate, while Well C had the lowest values for both. This strong correlation between the calculated approximate series and actual production validates the model’s ability to quantify fracture complexity and predict fracturing effectiveness.
Wrapping It Up
So, what’s the takeaway from all this? Analyzing shut-in pressure decline curves is still a powerful way to understand what’s happening downhole after hydraulic fracturing, especially in challenging fractured gas reservoirs. The traditional methods fall short because they don’t fully account for the complex interaction with natural fractures.
This research offers a fantastic step forward by:
- Providing a model that considers the dynamic leak-off process influenced by natural fracture closure.
- Using the fluctuations in the superposition derivative curve to identify and analyze different fracture closure stages.
- Introducing a robust multi-stage filtering method to get rid of annoying noise like the water hammer effect, making the data much more reliable.
- Giving us a quantitative way (the approximate series) to measure fracture network complexity, which directly correlates with how well the well will produce.
This kind of analysis isn’t just academic; it’s incredibly practical. By understanding the fracture network better, we can make smarter decisions about future fracturing operations, optimize production, and ultimately get more of that valuable gas out of the ground efficiently and effectively. It’s all about listening closely to what the reservoir is telling us when we give it a moment of quiet.
Source: Springer