Unlocking Ductile Iron Secrets: A New Way to Gauge Material Integrity
Hey there! So, let’s talk about something pretty cool in the world of materials, specifically a type of metal called Ductile Iron (DI). If you’re into how things are made, especially castings, you know that getting the material just right is super important. But here’s the thing: defects and tiny imperfections can really mess with how strong or durable a material is. This is a big deal in castings because they can be quite sensitive to things like their chemical makeup and, crucially, how thick different parts of the casting are – we call this “section thickness.”
Now, imagine you’re making a complex part. Some bits are thick, some are thin. They cool down at different rates, and that can lead to different microstructures and even defects like chunky graphite (CHG) or shrinkage porosity. Traditionally, we’d do tests like pulling the material until it breaks (tensile testing) or looking at it under a microscope to see the structure. But sometimes, especially with a tricky material like High Silicon Strengthened Ductile Iron (HSiSDI), the standard tensile results don’t quite tell the whole story about how ‘sound’ or ‘defective’ the material really is across those different thicknesses. It can be a bit misleading, you know?
That’s where this neat new approach comes in. Researchers have proposed a fresh way to assess the integrity of DI castings. It’s based on digging deeper into the tensile test data, specifically looking at how the material hardens as you stretch it – the strain-hardening behavior. By modeling this behavior using a specific equation (the Voce equation, if you want to get technical) and plotting the results in a special diagram (a Matrix Assessment Diagram, or MAD), they’ve stumbled upon something unexpected: even defective materials show a surprisingly regular strain-hardening pattern. They’ve dubbed this “Defects-Driven Plasticity” (DDP). And based on this DDP, they’ve defined a brand new number, a “Material Integrity Index” (MII).
I’ve been looking into this study that specifically applied this new MII to a particular type of DI – one with about 4.2% silicon. This grade is interesting because it’s fully ferritic, which makes it cheaper to produce (no heat treatment needed!), and it’s great for high-temperature applications like engine parts. But, as I mentioned, that high silicon content can also make it prone to those nasty defects like CHG and shrinkage porosity, especially in thicker sections where cooling is slower. So, assessing its section sensitivity is paramount.
Why High Silicon Ductile Iron is Both Awesome and Tricky
Okay, let’s zoom in on this 4.2 wt pct Si DI. It’s part of the HSiSDI family, now officially recognized in European standards. Why the buzz? Well, with silicon over 3%, it becomes fully ferritic. This is a big win because it means you can skip expensive heat treatments. Plus, it has a tight hardness range, which is great for machining. On the performance side, it boasts high yield strength (YS) and ultimate tensile strength (UTS), and surprisingly good elongation compared to older types of DI with similar strength. Silicon is the key here; it strengthens the matrix through solid solution hardening, boosting YS and UTS, while only slightly reducing ductility.
Peak strength seems to hit around 4.2-4.3% Si. But push it much higher, and things go south fast – strength and ductility drop off a cliff. The high silicon is also fantastic for high-temperature jobs, like exhaust manifolds that see temperatures north of 800°C. Add a bit of molybdenum, and you get even better high-temp stability and corrosion resistance.
But here’s the catch, and it’s a significant one: high silicon content promotes bad stuff. We’re talking chemical-ordering embrittlement, shrinkage porosity, and that dreaded chunky graphite (CHG). These things dramatically slash ductility, especially above 4.2% Si. And guess what makes these defects worse? Slow cooling rates, which are exactly what you get in the thicker sections of a casting. Silicon also tends to segregate negatively, hanging out more at the graphite-ferrite interface, which is the first bit to freeze. This can make embrittlement worse around graphite nodules and CHG aggregates, and it definitely depends on the casting section thickness.
So, understanding how different cooling rates (from different section thicknesses) affect the microstructure and mechanical properties of these high-Si DIs isn’t just academic; it’s essential for making reliable parts. We really need a solid way to assess this “section sensitivity.”
The Problem with Traditional Defect Detection
Material defects and discontinuities are like hidden saboteurs for mechanical properties, particularly in castings where variations in chemistry and thickness are common. The tricky part is that these defects aren’t easily quantifiable with standard quality control tools. Sure, you can use ultrasounds, look at fracture surfaces (fractography), or examine polished samples under a microscope (metallography), but getting a real *number* for defectiveness is hard. Advanced techniques like computer micro-tomography *can* quantify them, but they’re way too expensive and slow for routine checks.
This is why getting an integrity index from something as straightforward as a tensile test is so appealing. Tensile testing is standard practice, relatively cheap, and quick.
The new procedure I mentioned? It uses the tensile-flow curve analysis, modeling it with the Voce equation. The magic happens when you look at the strain-hardening rates in defective materials. Turns out, analyzing this with the dislocation-density-related Voce equation gives valuable clues about the defects. When you plot the parameters from the best-fit Voce equation for a bunch of tests in that Matrix Assessment Diagram (MAD), they don’t scatter randomly as you might expect from defects. Instead, they line up along straight lines. The characteristics of these lines (their slope and intercept) tell you if the casting is sound or defective. This unexpected regularity in defective materials’ strain-hardening is that “Defects-Driven Plasticity” (DDP) phenomenon, and it’s what led to the definition of the new Material Integrity Index (MII).

Putting the 4.2% Si DI to the Test
So, the study I’m talking about took this 4.2 wt pct Si DI and cast it into different shapes and sizes to get varying cooling rates. They used a round Lynchburg casting (25mm diameter, labeled L25) and three different Y-blocks (25mm, 50mm, and 75mm wall thicknesses, labeled Y25, Y50, and Y75), following standard procedures. They poured the molten metal at 1420°C into green sand molds.
They even simulated the cooling process to figure out the exact cooling rates, especially around the eutectic temperature (where the liquid metal starts solidifying into solid phases). As expected, the thinnest casting (L25) cooled fastest, and the cooling rate decreased significantly as the Y-block thickness increased (Y25, Y50, Y75). This is crucial because cooling rate directly impacts microstructure and defect formation.
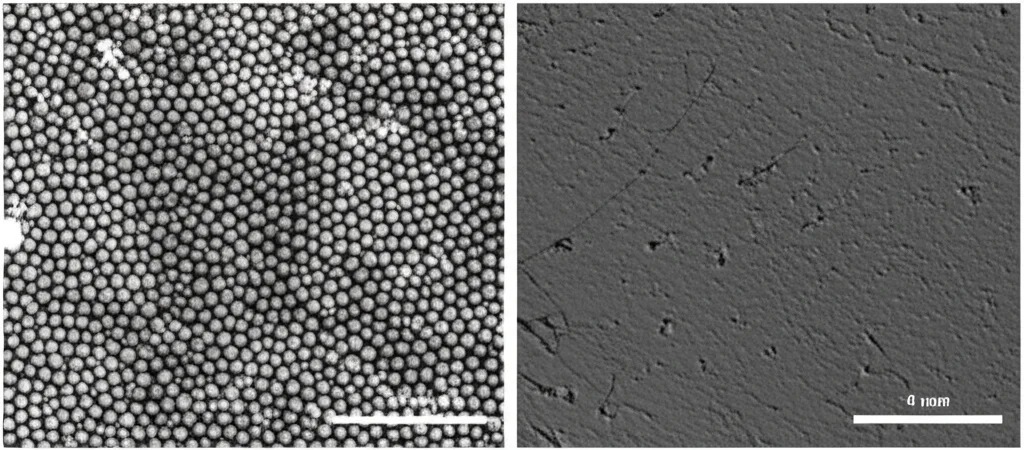
Next, they did all the standard analyses: looked at the microstructure under optical and scanning electron microscopes (SEM), measured things like ferritic grain size, nodule size, nodularity (how round the graphite is), and nodule count (how many graphite particles per area). They also examined the fracture surfaces after tensile testing to see what caused the breaks – looking for things like shrinkage porosity and CHG.
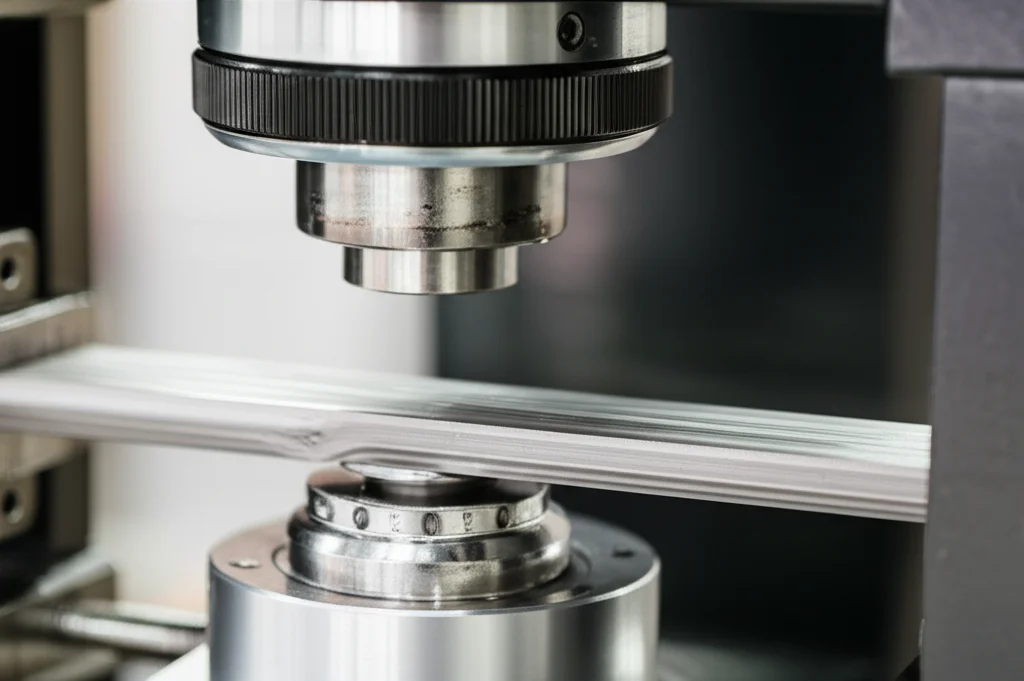
Then came the tensile tests. They pulled standard round specimens and recorded the stress-strain curves. For the strain-hardening analysis, they converted the engineering stress/strain data into true stress/plastic strain. This is where the Voce equation modeling comes in. They analyzed the strain-hardening rate (how much the material resists further deformation as you stretch it) against the stress, using a plot called a Kocks-Mecking plot. By fitting the data to the Voce equation, they extracted specific parameters (Θo and 1/εc), which were then plotted in the MAD. Remember, the lines in the MAD are supposed to tell us about the material’s soundness.
What the Microstructure Showed
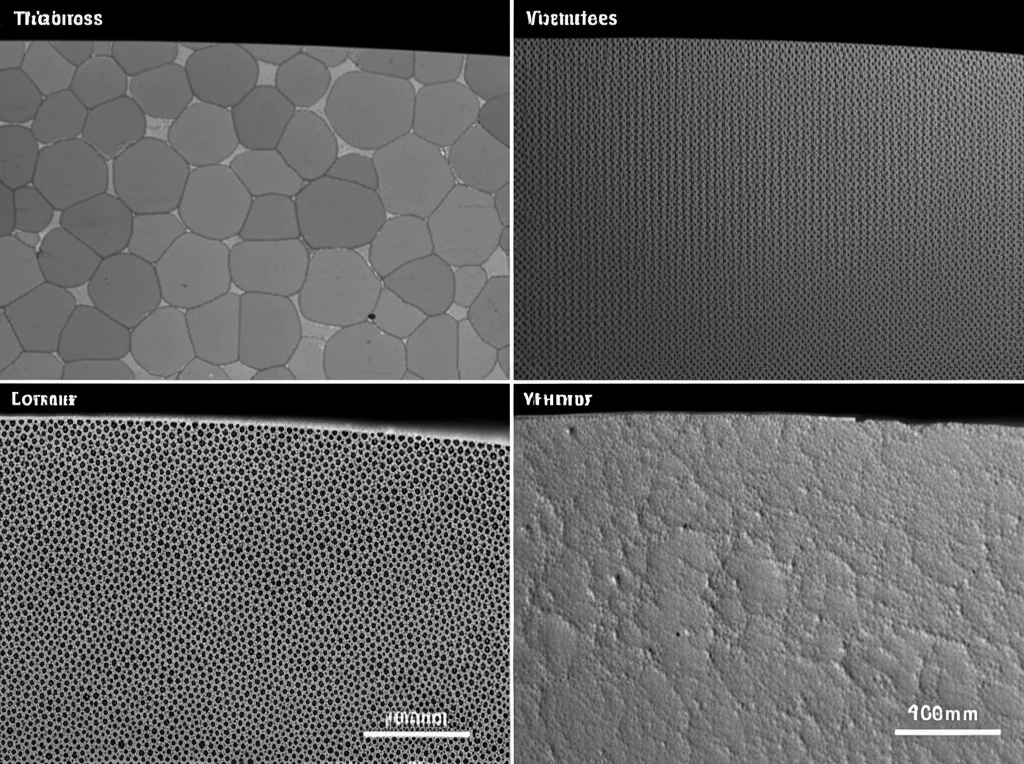
Looking at the samples under the microscope was really revealing. All the castings had a fully ferritic matrix, which is good. But the graphite structure varied a lot with section thickness.
- L25 (Fastest cooling): Had the smallest average nodule size, the highest nodule count, and excellent nodularity (87.5%). No chunky graphite (CHG) or pearlite was found. The ferrite grains were also the finest.
- Y25 (Intermediate cooling): Microstructure was somewhere between L25 and the thicker sections, consistent with its cooling rate. No CHG was found here either, which was a bit surprising compared to the even slower Y50/Y75.
- Y50 and Y75 (Slowest cooling): Showed larger nodule sizes, significantly lower nodule counts, and reduced nodularity (down to 73.3% in Y75). Crucially, a significant amount of CHG was present in both Y50 and Y75. The ferrite grains were also coarser in these thicker sections, especially Y75.
They even did a fancy analysis of the graphite particle sizes, confirming the presence of chunky graphite alongside the desired spheroidal graphite in the slower-cooled samples (Y50 and Y75). The amount of primary graphite (formed early in the melt) was also higher in the slowest cooled Y75.
Examining the fracture surfaces with the SEM was also eye-opening. Shrinkage porosity was visible in all samples, but it was much larger in the thicker Y50 and Y75 sections. The L25 and Y25 samples showed lots of ductile fracture regions with dimples around the graphite nodules, indicating good plasticity. But in Y50 and Y75, there were fewer dimples and a *huge* amount of CHG visible on the fracture surfaces. This is a key point: the amount of CHG seen on the fracture surface was way higher than what they saw in the polished cross-sections. This suggests that CHG acts as a crack nucleation site, making it more likely to be exposed when the material breaks.
The presence of CHG in thicker sections (Y50/Y75) and its absence in thinner ones (L25/Y25) is consistent with something called Henderson’s diagram, which relates carbon and silicon content to casting thickness and the likelihood of defects like graphite flotation (leading to CHG) or shrinkage porosity. High Si content combined with increasing thickness narrows the “safe” range for producing good spheroidal graphite.
The Conventional Tensile Results – A Bit Confusing?
Now, let’s look at the standard tensile properties (YS, UTS, A5 – elongation to fracture). The L25 and Y25 castings performed pretty similarly, with high YS, UTS, and significantly longer elongation compared to Y50 and Y75. This makes sense given their better microstructures (less CHG, better nodularity/count).
However, there were some oddities. Even though L25 had the *best* microstructure (highest nodularity, highest nodule count), its tensile properties were essentially the same as Y25. This suggests there might be a threshold for graphite quality – once it’s good enough, further improvements don’t necessarily boost conventional tensile strength and ductility much more. Also, the similar tensile curves for L25/Y25 hinted that their level of shrinkage porosity might be comparable, even if the graphite structure differed slightly.
For the thicker sections, Y50 and Y75, the UTS and A5 values dropped, which aligns with their worse graphite quality (lower nodularity/count, presence of CHG). But here’s the really confusing part: the YS of the Y75 casting was *higher* than that of Y50, and even similar to the YS of the much sounder L25 and Y25 castings! This didn’t fit at all with the microstructural findings, which showed Y75 had worse graphite quality and coarser ferrite grains than Y50. Conventional tensile results seemed to be giving us mixed signals about the integrity of Y75 compared to Y50.
The New MII Clears Things Up
This is where the strain-hardening analysis and the new MII really shine. Remember the MAD plot? When they plotted the Voce parameters for all the samples, the data from L25 and Y25 clustered together on one line, distinct from the data for Y50 and Y75, which fell on a different line. This separation in the MAD perfectly matched the microstructural differences (L25/Y25 being sounder with better graphite and less porosity than Y50/Y75).
The characteristics of these lines in the MAD confirm the soundness. The line for L25+Y25 had a lower slope and a less negative intercept compared to the line for Y50+Y75. According to the DDP theory, a less negative intercept means sounder material. So, the MAD analysis clearly indicated that the material from the thinner L25/Y25 sections was sounder than that from the thicker Y50/Y75 sections. This aligns beautifully with the microstructural evidence.
Now, let’s look at the MII values themselves. The MII values for L25 and Y25 were very close (+0.200 and +0.203), suggesting they had the same level of soundness. This is consistent with their similar microstructures (no CHG) and overlapping tensile behaviors, even though L25 had better nodularity/count than Y25. It reinforces that idea of a threshold for graphite quality.
But here’s the key insight: the MII values for Y50 and Y75 were different (-0.006 and -0.050, respectively). The more negative MII for Y75 indicated it was *more* defective than Y50. This finding is perfectly consistent with the microstructural analysis, which showed Y75 had worse nodularity and a higher quantity of CHG compared to Y50. This is where the conventional tensile results (specifically the higher YS in Y75 compared to Y50) were misleading.
The DDP concept explains that higher yield stress in defective materials like Y75 can happen because defects act like tiny notches. At the very beginning of plastic deformation, these notches intensify stress locally, amplifying dislocation multiplication and making the material seem stronger (higher YS). But after that initial stage, cracks start forming at these defects (like CHG and porosity) and grow, reducing the load-bearing area and causing the overall strength (UTS) and ductility (A5) to drop, eventually leading to fracture. The “pivotal stress” derived from the strain-hardening analysis represents a crossover point between this initial amplified hardening and the final fracture process.
Wrapping It Up: Why the MII is a Game Changer
So, what did we learn from all this? First off, for this 4.2 wt pct Si DI, both the microstructure and mechanical properties are definitely sensitive to section thickness and cooling rate. Thinner sections (L25, Y25) cooled faster, resulting in better graphite structures (higher nodularity, nodule count, no CHG) and finer ferrite grains compared to thicker sections (Y50, Y75).
Conventional tensile properties confirmed that L25/Y25 were generally better than Y50/Y75. However, they failed to distinguish between L25 and Y25 (despite L25 having a superior microstructure) and gave a confusing result for Y75’s yield strength relative to Y50, contradicting the microstructural evidence that Y75 was worse.
This is where the new Material Integrity Index (MII), derived from the strain-hardening analysis and the DDP concept, really proved its worth. The MII values correctly identified L25 and Y25 as having the same level of soundness, consistent with their similar tensile behavior and absence of CHG. More importantly, the MII correctly showed that Y75 was *more* defective than Y50, aligning perfectly with the microstructural findings (worse nodularity, more CHG in Y75). The seemingly contradictory higher YS in Y75 was rationalized by the DDP phenomenon.
What this tells us is that relying solely on conventional tensile properties might not give you the full, accurate picture of a casting’s integrity, especially for materials prone to defects influenced by cooling rate. The MII, combined with strain-hardening analysis and the MAD, offers a deeper, more reliable insight into the quality level of castings. It can reveal differences in integrity that traditional tests might miss or misinterpret.
For manufacturers working with these advanced DI grades, especially for critical applications, this new MII could be a really valuable tool for quality control and process optimization. It helps bridge the gap between microstructure, mechanical behavior, and the subtle effects of defects, giving a more complete assessment of how a casting will truly perform.
Source: Springer


