Unlocking the Secrets: Genes Linking Diabetes and Depression
Hey there! Let’s talk about something pretty serious that affects a whole lot of people: Type 2 Diabetes (T2DM) and Major Depressive Disorder (MDD). Now, these two conditions are tough enough on their own, right? But here’s the kicker – they often go hand-in-hand, and when they do, things get significantly worse. We’re talking increased health problems and, sadly, higher mortality rates. It’s a real challenge for patients and doctors alike.
You see, T2DM and MDD aren’t just casually hanging out together; they actually seem to increase the risk of the other popping up. It’s like a vicious cycle. But *why* do they do this? What are the underlying biological connections? That’s been a bit of a mystery, and frankly, figuring out the best way to treat someone dealing with both is still something researchers are actively trying to nail down. Some folks benefit from standard treatments, others don’t, which just adds to the complexity.
So, our team embarked on a bit of a detective mission. We wanted to dive deep and find some potential shared players – specifically, genes – that might be involved in this tricky comorbidity. The idea is that if we can pinpoint these key genes, they might serve as helpful markers for diagnosis or even targets for new treatments. This could seriously improve how we manage these conditions, boost patient outcomes, and lighten the overall burden on society.
Our Detective Work: Bioinformatics Meets Biology
Our approach was pretty cool, if I do say so myself. We started with a massive amount of data – gene expression profiles from public databases (like the Gene Expression Omnibus, or GEO) from people with T2DM and people with MDD. Think of it like sifting through mountains of digital information about which genes are active or inactive in different groups of patients.
We used some sophisticated computational tools, often called bioinformatics, to make sense of this data. We employed methods like Weighted Gene Co-expression Network Analysis (WGCNA) to find groups of genes that act together, and Protein-Protein Interaction (PPI) networks to see how the proteins these genes make might interact. We even threw in some machine learning algorithms – basically, teaching computers to spot patterns – to help us identify the most important genes, or “hub genes,” that seemed relevant to both conditions.
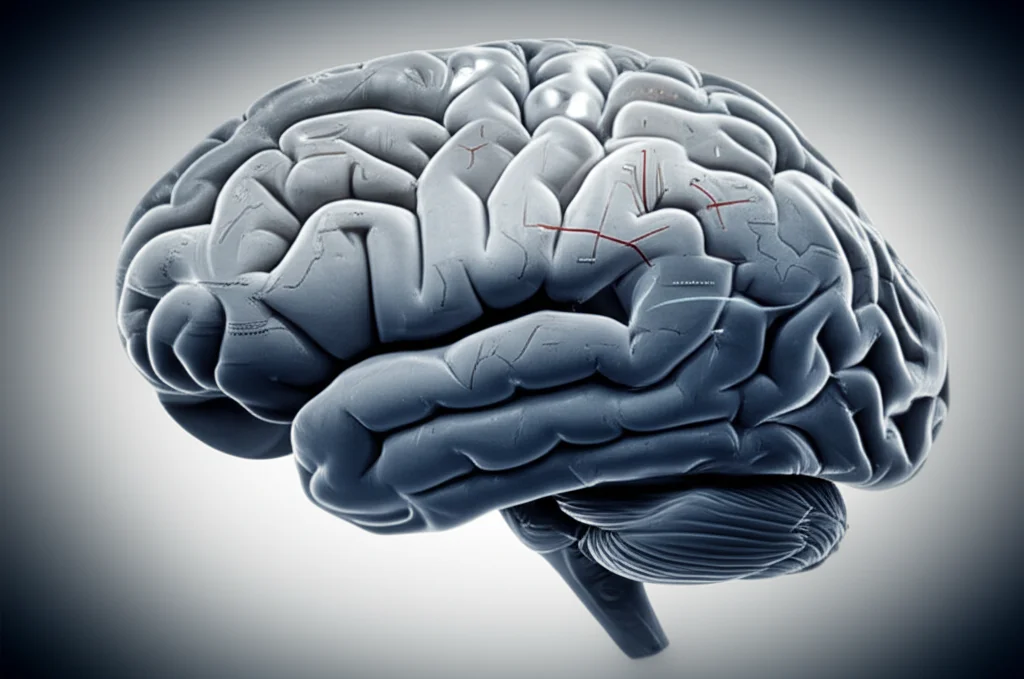
After all that digital digging, we narrowed down a list of potential suspects. But just finding genes in databases isn’t enough; we needed to see if they actually played a role in a living system. So, we moved to the lab and used a mouse model designed to mimic diabetes with depression (DD). The plan was to check if these identified genes were behaving differently in the brains (specifically, the hippocampus, which is important for mood and memory) of these mice compared to healthy ones.
Finding the Shared Players
Our bioinformatics journey was quite revealing. We analyzed the gene expression data from T2DM and MDD patients separately at first. For the T2DM data, we combined a couple of datasets to get a better picture, carefully cleaning and normalizing the data to make sure everything was comparable. Using WGCNA, we found several modules, or groups, of genes that were significantly correlated with T2DM status. Some were positively correlated (higher activity in T2DM), and some were negatively correlated (lower activity).
Then, we looked at the MDD data and identified genes that were differentially expressed (DEGs) between patients with depression and healthy controls. We found hundreds of these DEGs.
The real magic happened when we looked for the overlap. We intersected the genes from the T2DM-associated modules with the MDD DEGs. This gave us a list of 25 genes that showed up in both analyses – genes potentially involved in the comorbidity of T2DM and MDD. We called these the DD potential genes (DDPGs).

We then did some enrichment analysis on these 25 genes to see what biological functions or pathways they might be involved in. Turns out, they seem to play roles in things like:
- Molecular Function: Binding to proteins, regulating molecular activity, especially related to the cytoskeleton (the cell’s internal scaffolding).
- Cellular Component: Parts of the cell like myofibrils, the cell cortex, sarcomeres – all structures heavily involving the cytoskeleton.
- Biological Process: Regulating muscle contraction, protein breakdown, and processes involving actin filaments (a key part of the cytoskeleton).
They also popped up in pathways related to immune responses (Toll-like receptor signaling, Chemokine signaling), lipid metabolism (Lipid and atherosclerosis), and, you guessed it, the cytoskeleton in muscle cells. This suggests these genes are involved in fundamental cellular processes that could link metabolic issues, inflammation, and brain function.
Next, we built a protein-protein interaction network from these 25 genes to see which ones were most connected. Using several algorithms to rank their importance within this network, two genes consistently stood out in the top ranks: AKT1 and CAPZA2. These looked like strong candidates for being central “hub” genes.
Simultaneously, we used machine learning (Boruta and SVM-RFE algorithms) on the T2DM and MDD datasets to identify characteristic genes for each condition. We then looked for the overlap between the genes selected by *both* algorithms in *both* datasets. This led us to another list of 5 genes: UBTD1, ANKRD9, NUDCD3, CNN2, and FKBP14. We checked if their expression patterns were consistent in T2DM and MDD. Three genes fit the bill: UBTD1, ANKRD9, and CNN2. These also looked promising as potential biomarkers.
So, by combining the PPI network analysis and the machine learning approach, we ended up with a final list of 5 potential hub genes for DD: UBTD1, ANKRD9, CNN2, AKT1, and CAPZA2. Pretty neat, right?
Checking Diagnostic Potential
Finding these genes is one thing, but could they actually help diagnose DD? We put them to the test by creating ROC curves (Receiver Operating Characteristic curves) and calculating AUC values (Area Under the Curve). Think of AUC as a measure of how well a test can distinguish between two groups (in this case, people with the condition vs. controls). An AUC of 1 is perfect, 0.5 is random chance.
We did this using the original T2DM and MDD datasets and also validated it in an independent MDD dataset (GSE66937). To be considered good diagnostic candidates, the genes needed an AUC greater than 0.7 in *both* the training and validation sets. Three genes made the cut: ANKRD9, CNN2, and UBTD1.
We even built a nomogram – a visual tool that uses these three genes’ expression levels to predict the likelihood of DD progression. This nomogram had an impressive AUC of 0.89, suggesting that using these three genes together could be a really effective way to help diagnose DD.
Validating in Our Mouse Friends
Now for the *in vivo* part! We created a DD mouse model by feeding mice a high-fat diet (to induce diabetes-like symptoms) and then subjecting them to chronic unpredictable mild stress (CUMS) to induce depressive-like behaviors. We checked their blood sugar, body weight, and did behavioral tests (Tail Suspension Test and Forced Swimming Test) to confirm they had both diabetic symptoms and depressive-like behaviors. And yes, our model mice showed significantly higher blood sugar, impaired glucose tolerance, and increased immobility in the behavioral tests compared to control mice.
Then, the big test: checking the expression of our 5 potential hub genes in the hippocampus of these DD mice using qRT-PCR (a method to measure gene activity). Here’s what we found compared to control mice:
- CNN2, CAPZA2, and AKT1 were significantly *upregulated* in the DD mice hippocampus.
- ANKRD9 was significantly *downregulated* in the DD mice hippocampus.
- UBTD1 showed no significant change in the DD mice hippocampus.
This was mostly consistent with the trends we saw in the human MDD data for CNN2, CAPZA2, and AKT1. However, UBTD1 and ANKRD9 showed *opposite* trends in the mouse hippocampus compared to the human MDD data. This isn’t totally unexpected; differences between species and the specific conditions being modeled (T2DM, MDD, and the combined DD) can lead to variations. But overall, the *in vivo* results largely supported our bioinformatics findings, reinforcing these genes as potential biomarkers and therapeutic targets.
Diving Deeper: What Might These Genes Be Doing?
Okay, so we found these genes and saw they’re acting differently in DD. But *how* might they be contributing to the problem? The researchers dug into what’s known about these genes to propose some potential mechanisms.
UBTD1: The Protein Cleanup Regulator
This gene is involved in the ubiquitin-proteasome system, which is like the cell’s recycling plant for proteins. It’s been studied a lot in cancer, sometimes being upregulated, sometimes downregulated – a bit paradoxical! It seems to influence cell fate partly by affecting p53 (a tumor suppressor) and YAP (involved in cell growth and organ size). Interestingly, YAP is linked to insulin resistance and also processes involved in depression like inflammation and oxidative stress. So, UBTD1 might be connecting diabetes and depression through these complex pathways.
ANKRD9: The Multifunctional Player
ANKRD9 has a cool structure (ankyrin repeats) that lets it interact with lots of other proteins, involved in things like lipid metabolism and even copper levels in cells. Dysregulated lipid metabolism is a big deal in both diabetes and depression. ANKRD9 might influence this. Plus, it affects a protein (ATP7A) that handles copper. Copper levels are important for brain function and are altered in depression. Copper also seems linked to lipid metabolism and insulin resistance. So, ANKRD9 could be a central player linking copper, lipids, and brain issues in DD.
CNN2: The Cytoskeleton Stabilizer
CNN2 helps stabilize the cell’s internal skeleton, specifically actin filaments. This is crucial for cell shape and movement. It’s been suggested as a risk gene for Alzheimer’s and seems involved in regulating inflammation, particularly in immune cells like macrophages. Macrophages without CNN2 are less inflammatory. This suggests targeting CNN2 might help reduce the neuroinflammation seen in DD. CNN2 is also involved in autophagy, the cell’s self-cleaning process. High blood sugar in diabetes can mess with autophagy in the brain, potentially explaining why CNN2 might be upregulated in DD. Plus, a stiff cytoskeleton, influenced by CNN2, has been linked to metabolic and mood problems in mice. CNN2 could be linking inflammation, autophagy, and cytoskeletal issues in DD.
CAPZA2: Another Actin Manager
CAPZA2 is part of a complex that caps actin filaments, controlling their length. This is vital for cell shape and movement. It’s been linked to fat cell growth and differentiation, connecting it to lipid metabolism. Actin dynamics are also super important for synapses – the connections between brain cells – which are crucial for brain function and plasticity. CAPZA2 might affect DD by messing with this synaptic plasticity through cytoskeletal changes. It also seems to play a role in endosomal trafficking – how cells transport stuff inside them. This transport system is key for releasing neurotransmitters, and problems with it are linked to neurodegenerative diseases and diabetes. CAPZA2 could be disrupting neurotransmitter release, impacting mood and stress responses.
AKT1: The Central Regulator
AKT1 is a major player in a crucial signaling pathway (PI3K/AKT) that affects cell survival, growth, metabolism, and blood vessel formation. It’s been studied extensively in T2DM; normally, it helps regulate metabolism, but in insulin resistance, its activity is suppressed. Reactivating it might help T2DM. AKT1 is also critical for depression. It’s involved in pathways that affect brain-derived neurotrophic factor (BDNF), synaptic plasticity, and inflammation. Stress can suppress AKT1 activity, leading to depressive behaviors.
Now, here’s that interesting paradox again: we saw *elevated* AKT1 mRNA in the hippocampus of DD mice and human MDD patients, even though its activity is often *suppressed* in these conditions. The researchers propose this might be a compensatory mechanism – the body tries to make more AKT1 (higher mRNA) to counteract the functional suppression caused by the disease environment (inflammation, oxidative stress). It’s like the cell is yelling “Make more AKT1!” but the protein it makes isn’t working properly. This complex dance between making the protein and its actual function could be key in DD.
Putting It All Together: A Complex Picture
So, the picture that emerges is pretty complex. These genes aren’t working in isolation. They seem to be part of an intricate network where energy metabolism, cell signaling, and cytoskeletal organization are all intertwined and out of balance in DD.
UBTD1 might be messing with cell fate and metabolism through YAP and p53. ANKRD9 could be disrupting copper and lipid balance, affecting both metabolism and brain connections. CNN2 and CAPZA2 are likely messing with the cell’s internal skeleton, impacting inflammation, autophagy, synaptic function, and even how neurotransmitters are handled. And AKT1, the central hub, is trying to regulate all sorts of things, but its activity seems suppressed despite increased production signals.
It’s like a dysfunctional orchestra where different sections are playing out of tune, trying to correct themselves, but the conductor (AKT1 activity) isn’t quite working right. This imbalance leads to the symptoms we see in DD. Understanding these interactions offers exciting new avenues for potential treatments that could target specific parts of this network.
Acknowledging the Bumps in the Road
Now, no study is perfect, and ours has its limitations. For starters, while we found these genes and saw expression changes, we didn’t directly prove *how* they cause DD symptoms. That would require more functional experiments, like turning genes on or off in models. We also only looked at mRNA levels, not the actual protein levels or their activity, which are crucial for function.
Our mouse model is super helpful, but mice aren’t tiny humans. There are differences in biology and how diseases manifest, which might explain some inconsistencies between our mouse findings and human data. Also, the human datasets we used, while valuable, had relatively small sample sizes, which can sometimes limit the power and generalizability of the findings. We tried to mitigate this with validation sets and rigorous methods, but it’s still a factor.
Speaking of validation, the independent human dataset we used for MDD validation primarily focused on suicide cases. While MDD is a major risk factor for suicide and there are overlapping mechanisms, they aren’t identical conditions. So, we need to be cautious when generalizing those specific validation results to the broader MDD population.
What’s Next? The Road Ahead
Despite these limitations, our study provides some really valuable insights. Identifying these hub genes and proposing mechanisms is a big step. But there’s a lot more work to be done!
Future research needs to:
- Do functional studies (like gene knockout or overexpression) in animal models to directly test the roles of these genes in causing DD symptoms.
- Validate these findings in larger human cohorts, perhaps through multi-center studies, using different types of samples (like blood or even brain tissue if possible).
- Explore the protein levels and activity of these genes, not just the mRNA.
- Investigate the potential of these genes as diagnostic markers in clinical settings through rigorous trials.
- Develop and test potential therapeutic strategies that target these genes or their pathways. This is a big one and requires careful evaluation of safety and efficacy, moving from lab studies to clinical trials.
Translating findings from animal models to human treatments is always a challenge, requiring careful steps and collaboration across different scientific fields.
Wrapping It Up
In conclusion, our study, using a blend of cutting-edge bioinformatics and laboratory experiments, has shed some much-needed light on the complex relationship between Type 2 Diabetes and Major Depressive Disorder. We’ve identified five potential hub genes – UBTD1, ANKRD9, CNN2, AKT1, and CAPZA2 – that seem to be right at the heart of this comorbidity.
Three of these (ANKRD9, CNN2, and UBTD1) showed promising potential as diagnostic markers. We also proposed how these genes might contribute to DD through intricate pathways involving protein regulation, cytoskeletal dynamics, lipid and copper metabolism, and crucial signaling like the AKT pathway.
This work doesn’t provide all the answers, but it certainly offers new perspectives and a solid foundation for future research. We believe these genes are valuable candidates for further investigation, potentially leading to better ways to diagnose and treat this challenging combination of conditions. It’s an exciting area, and we’re just getting started!
Source: Springer