Why Your Bike Lane Preferences Might Be Different Than Mine
Okay, so let’s talk bikes. We all know cycling is a big deal for making our cities and towns greener and healthier, right? It’s been on the agenda for ages, and honestly, it works! Studies consistently show that when you build more and better bike infrastructure, more people hop on bikes, and guess what? Fewer accidents happen too. It makes total sense – people feel safer when they’re not duking it out with cars.
And when we talk about feeling safe, that’s huge. Like, the most important factor huge for getting more folks cycling. Generally, the more separated you are from car traffic, the safer you feel. It’s the golden rule of bike-friendly design.
Who’s Riding What? The Different Types of Cyclists
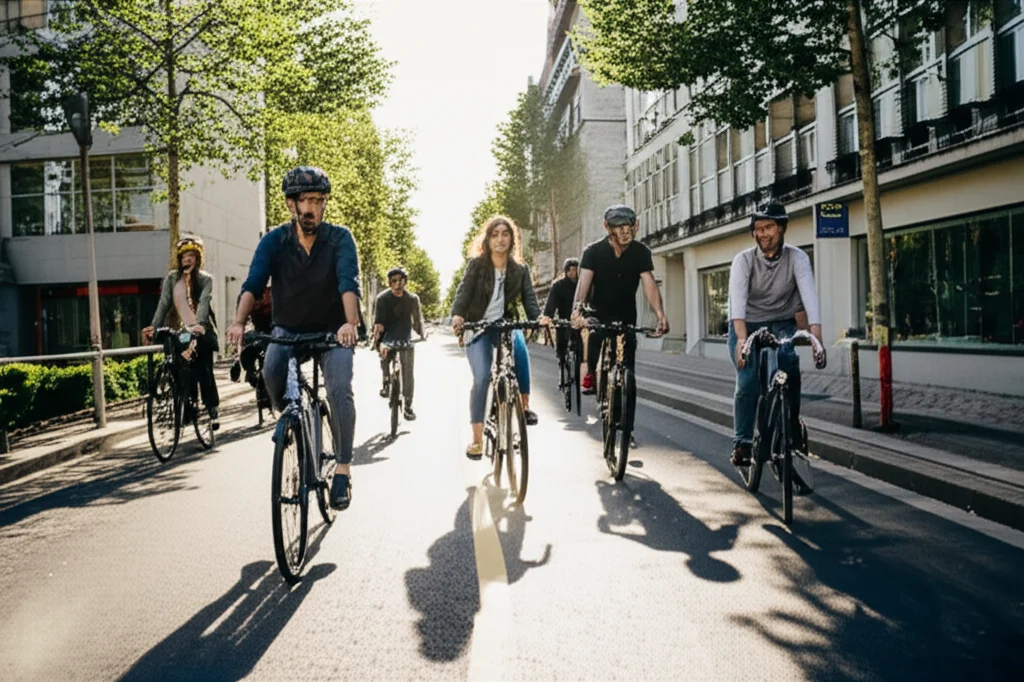
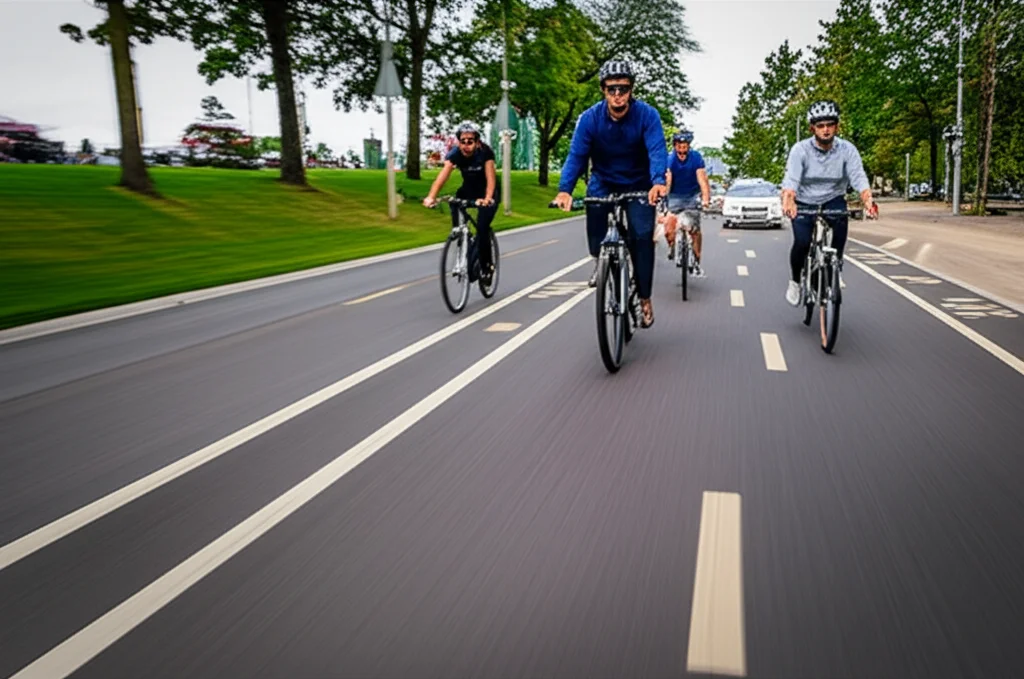
But here’s the thing that’s becoming super clear: not everyone on two wheels is the same. You’ve got your classic pedal-power purists, sure. But then there’s the whole electric revolution! E-bikes (usually capped at 25 km/h) and their faster cousins, the s-pedelecs (up to 45 km/h), are booming. Especially in places like Switzerland, where this study took place – those hills are way less daunting with a little electric assist!
And this isn’t just about speed. E-bikes are bringing new people into cycling – maybe folks who couldn’t manage the physical effort before. They’ve got massive potential to replace car trips, even longer ones. So, if we’re serious about sustainable transport, we *have* to understand what these different riders need and want from their bike routes.
Putting Preferences to the Test: The Survey Setup
That’s exactly what we set out to do. We wanted to figure out what influences cycling infrastructure preferences, especially looking at these different bike types and how often people actually ride. We used something called a ‘stated-preference survey.’ Think of it like this: we showed people pictures of different street setups – main streets, neighborhood streets – with various cycling features (or lack thereof) and different amounts of car traffic. We also varied the travel time for these routes.
Then, we simply asked them: “Which route would you prefer?” By seeing what trade-offs people were willing to make (like, would you take a slightly longer route for a better bike lane?), we could figure out how much they *value* those different infrastructure features. We recruited people who rode conventional bikes, e-bikes, s-pedelecs, and even folks who didn’t cycle at all, to get a really broad picture.
We made sure the images looked realistic and felt like Switzerland, tweaking details like signs and road markings. To keep it from being too much work for participants, we split the choices into blocks, so nobody had to answer a million questions. We looked at choices between main and neighborhood streets, and then choices just between different versions of main streets or neighborhood streets.
What We Found: The Big Picture
Alright, results time! The first big takeaway, which isn’t totally surprising but is good to confirm, is that everyone generally prefers more separation from cars. That direction of preference is pretty consistent across the board for most things we looked at.
But the *strength* of that preference? That’s where things get interesting. It turns out, your bike type, how often you ride, and yes, your gender, play a significant role in how much you value different street designs.
Bike Type and How You Ride: It Makes a Difference
We found that e-bikers, and especially s-pedelec riders, seem a bit more comfortable sharing the road space with cars compared to conventional cyclists. They also showed a lower “willingness to pay” (in terms of extra travel time) for infrastructure improvements. This makes some sense, right? S-pedelecs go pretty fast, sometimes close to car speeds in urban areas, and they can accelerate quickly. They might feel less vulnerable in mixed traffic.
E-bikers (the 25 km/h kind) were often somewhere in between conventional cyclists and s-pedelec riders. For really important safety stuff, like preferring a dedicated cycling path over just a painted lane on a main street, or wanting neighborhood streets designated as “cycling streets” (where bikes have priority), e-bikers’ preferences were actually quite similar to conventional cyclists.
Frequency matters too. Folks who cycle less often? They really, really value those safety-related elements like paths and cycling streets *more* than frequent cyclists do. It’s like they need that extra reassurance to get out there. Conversely, less frequent cyclists seemed to care *less* about features related to car traffic itself.
The Gender Factor: A Huge Piece of the Puzzle
Now, here’s where it gets really interesting, and honestly, pretty striking. Gender seems to be an even bigger driver of preferences than how often you cycle or what bike you ride. Specifically, women who don’t cycle at all are the most sensitive group to the differences in street design we showed them. Their preferences were the strongest for cycling-friendly features.
This aligns with other research showing women often have higher safety concerns and are more risk-averse in traffic than men. This higher sensitivity to the built environment helps explain why fewer women cycle compared to men. What’s fascinating is that even men who don’t cycle have preferences closer to those who *do* cycle than to women who don’t cycle. Maybe it’s that perceived lower likelihood of bad outcomes that men often report.
We tried to account for the fact that people who cycle more are simply more exposed to different street environments. But even when we did that, the gender differences were still very clear. Non-cycling women, for example, were two to four times more sensitive than non-cycling men to things like traffic levels or the presence of parking in neighborhood streets, or having bike paths instead of lanes on main streets.
Among frequent or sporadic cyclists, women still often showed a higher preference for cycling-friendly designs than men, although the differences weren’t always as massive as in the non-cycling group. Frequent s-pedelec riders were the group that seemed to value cycling-friendly designs the least overall, which, again, makes sense given their speed and ability to keep up with traffic.
Digging into the Details: Specific Infrastructure Features
Let’s look at what specific things people liked or disliked. Across almost all groups, a few things consistently came out on top:
- Low-traffic neighborhood streets: People really value not having to deal with lots of cars where they live or cycle through quiet areas.
- Neighborhood streets without parking: Removing parked cars reduces potential conflicts and makes the street feel safer and more open for cycling.
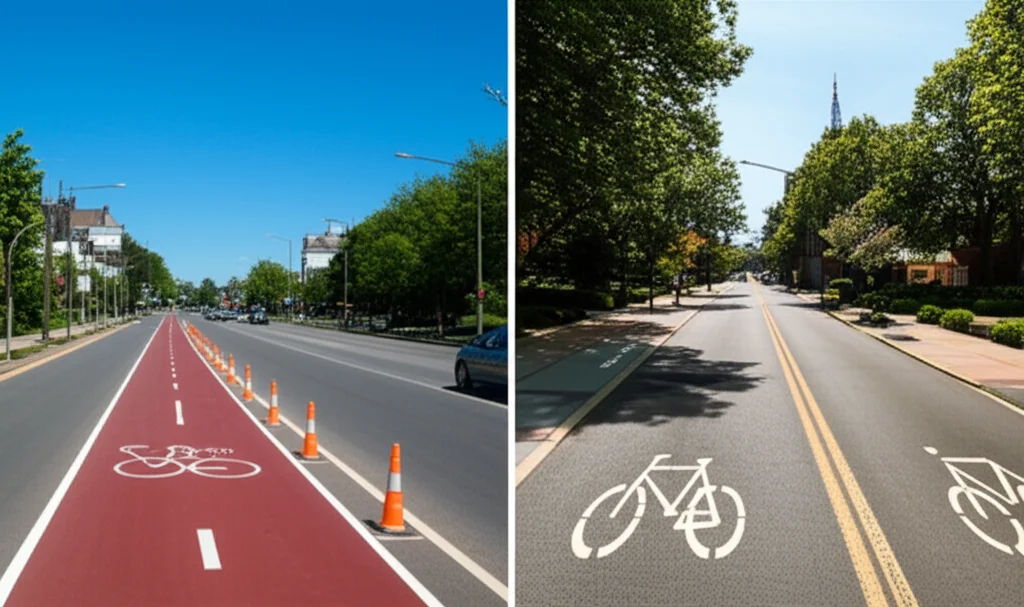
- Cycling paths instead of cycling lanes on main streets: This is the big one for safety. Physically separating bikes from fast-moving cars is highly valued.
- No parking on main streets (for cycle lanes) and wide cycling lanes: Again, anything that reduces potential conflict points with cars is a win.
These preferences all point back to that core desire for reduced conflict with motorized traffic. Cycling paths are often seen as the “gold standard” for safety, and our findings support that, especially for groups less comfortable in traffic.
Paths, Lanes, and Neighborhood Vibes
While cycling paths scored highest for many groups, they weren’t the absolute top preference for *everyone*. For example, frequent s-pedelec riders valued lower traffic and fewer parked cars in neighborhood streets slightly more than cycling paths. This could be because paths might slow them down if they get stuck behind slower cyclists, and they’re already comfortable riding faster alongside cars.
We also looked at neighborhood streets versus main streets. Generally, main streets were preferred, possibly because they’re seen as more direct and better connected to destinations like shops. However, making big improvements to neighborhood streets – like drastically reducing traffic and removing parking – significantly increased their appeal for most groups. Still, even with those improvements, a main street with a dedicated cycling path was often preferred over a traffic-calmed neighborhood street, except for one group: male conventional cyclists. They were the only ones where a neighborhood cycling street was slightly preferred.
Physical Separation: A Mixed Bag?
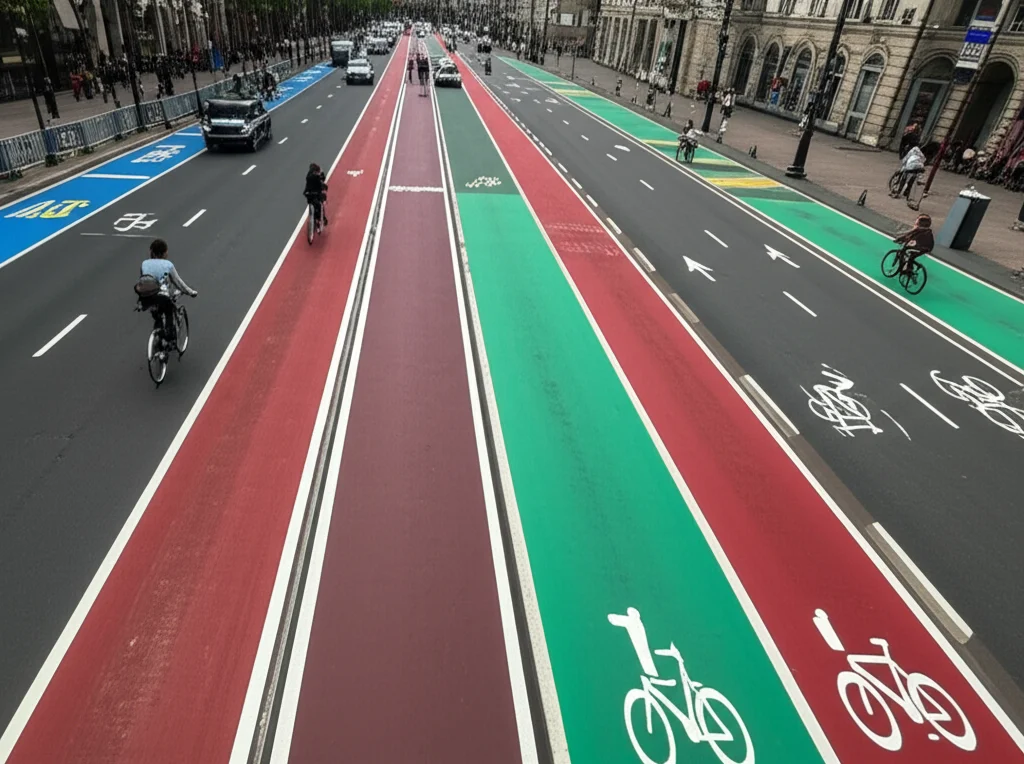
We also tested different ways of physically separating bike lanes from car lanes, like using bollards or those “UFO-style” separators that cars can still drive over (to access parking, for example). This is where things got a bit mixed.
For bollards, many groups didn’t see much improvement compared to just a painted lane, and a couple of groups actually found them worse! This contrasts a bit with other studies, and might be down to the specific design of the bollards, the local traffic context (Swiss vs. a big metropolis like Berlin), or simply different experiences among riders. One guess is that faster riders, like some s-pedelecs, might dislike bollards because they make overtaking slower cyclists more difficult and potentially dangerous.
The UFO-style separators were generally preferred over lanes without physical separation. Maybe because they offer some protection but still allow for easier maneuvering like overtaking.
So, What Does This Mean for Making Better Bike Cities?
Our findings really hammer home that cycling paths, especially wide ones, are the most preferred infrastructure. They offer the highest level of perceived and actual safety. This isn’t new, but our study adds a crucial layer: this preference is strongest among non-cycling women. If the goal is to get more people cycling overall, focusing on expanding high-quality, separated paths is probably the most effective strategy, particularly for attracting women.
It also shows that while improving neighborhood streets by reducing traffic and parking is valuable and makes them much more appealing, it often doesn’t quite beat the preference for a dedicated path on a main street, likely because main streets offer more direct routes to destinations.
Understanding these differences is key for policymakers. You can’t just build one type of infrastructure and expect it to work for everyone. While the *direction* of preference (separation good) is shared, the *intensity* varies greatly. Targeting infrastructure improvements based on who you want to encourage to cycle (e.g., non-cycling women) means prioritizing different features (like paths) over others.

A Few Caveats and What’s Next
A couple of things to keep in mind. The “willingness to pay” values we calculated (in terms of minutes of travel time) were sometimes quite high. This might suggest that for some people, especially non-cyclists, the real decision isn’t just which route to take, but whether to cycle *at all* based on the available infrastructure quality. If the infrastructure isn’t good enough, they simply won’t ride.
Also, non-cyclists were evaluating hypothetical situations without real-world experience on a bike. While their preferences for safety are clear, actual experience might shift their views. Our results do show that having cycling experience leads to different evaluations.
Finally, while we looked at a lot, there are always more infrastructure types to study (like contra-flow lanes). Future research could also combine this kind of survey data with actual GPS tracking data from cyclists to get an even richer picture of how preferences translate into real-world route choices.
But even with those points, the core message is clear: cycling preferences are diverse, shaped by the bike you ride, how often you ride it, and especially your gender. Building more separated infrastructure is the most consistent way to improve subjective safety and encourage more people, particularly women, to cycle.
Source: Springer