Unmasking the Air We Breathe: Long-Term PM2.5 Secrets from an Asian Community
Hey there! Let’s talk about something super important that affects us all: the air we breathe. Specifically, those tiny little particles known as PM2.5. You know, the ones smaller than the width of a human hair? They might be small, but boy, do they pack a punch when it comes to our health. Scientists have linked both short-term and long-term exposure to these little guys with all sorts of adverse health effects. So, understanding *where* and *when* we’re exposed is a really big deal.
Traditionally, air quality monitoring has relied on big, expensive stations. They’re great for getting a general idea of air quality over a large area, but they often miss the nitty-gritty details happening right on our streets, where we actually live, work, and play. This is especially true in dense, vibrant communities like many in Asia, where local stuff – like cooking smells, traffic jams, or even cultural practices – can really change the air quality from one block to the next.
That’s where the cool new kids on the block come in: low-cost sensors (LCSs). These little gadgets have totally shaken up the world of air monitoring. Researchers have gotten really good at making them reliable and accurate, almost like their fancy, expensive cousins. And the best part? You can deploy a whole network of them! This means we can finally start seeing air quality not just as a single number for a whole city, but as a dynamic, ever-changing map right down at the street level.
While many studies have used LCSs for short bursts of monitoring – maybe a few weeks or months – we wanted to do something different. We wanted to settle in, get comfortable, and really see what the air was doing over the *long haul*. And we wanted to see it from the perspective of someone walking down the street, not from a sensor perched high up on a building. So, we embarked on a pretty ambitious project: monitoring PM2.5 at street level in a specific Asian community for a whopping 3.5 years!
Setting the Scene: Our Community Lab
The community we focused on is nestled in a mountainous region in Taiwan. It’s a beautiful spot, but being surrounded by mountains means air doesn’t move around as much as you’d like, trapping pollutants. On top of that, pollutants from the wider plain can get blown in. So, you’ve got this mix of regional pollution and local stuff happening right there. And what’s the local stuff? Well, like many places, there’s traffic. But this community also has busy markets, food vendors (think delicious fried treats!), and several temples where people engage in traditional practices like burning incense and paper money. It’s also a popular tourist spot, especially on weekends, which brings even more activity and, you guessed it, more potential pollution.
Our Tools of the Trade: The AS-LUNG-O Crew
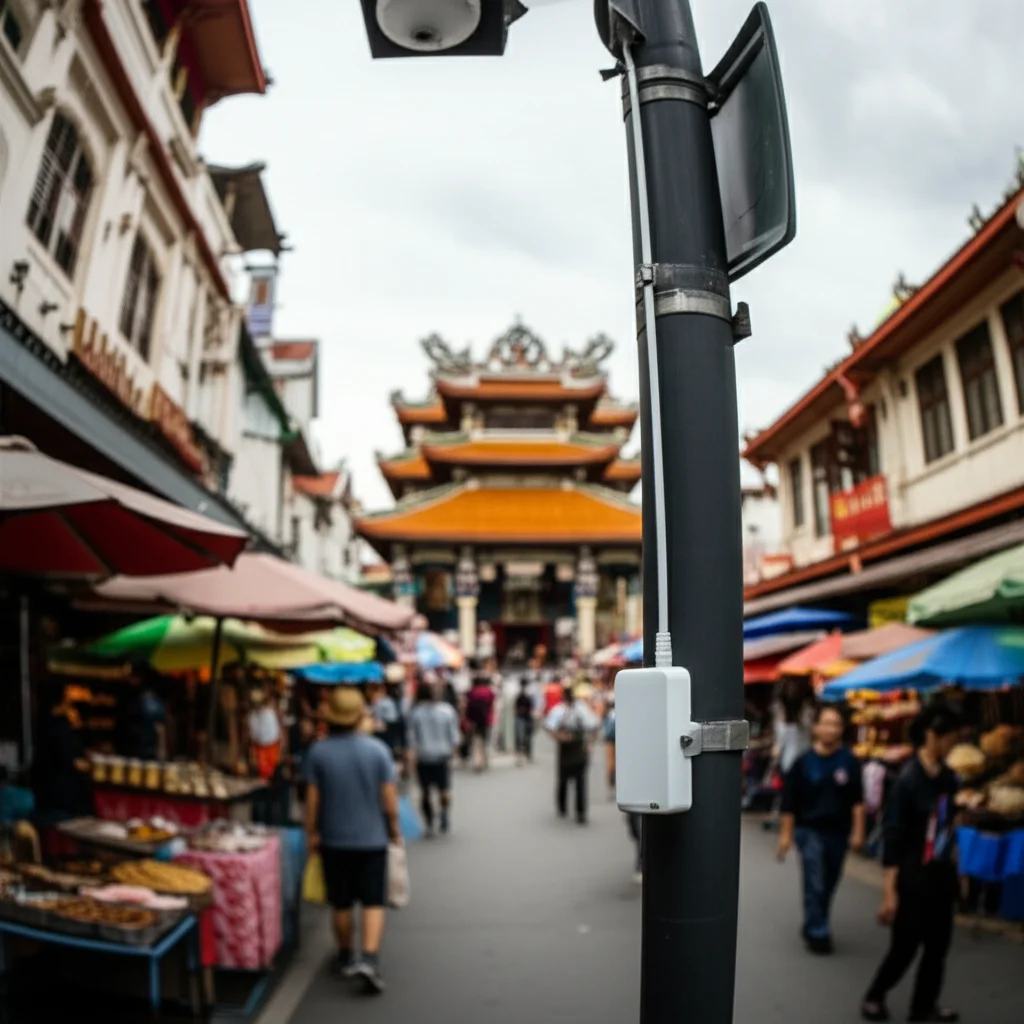
To get this job done, we used these neat little devices called AS-LUNG-O sensors. Think of them as research-grade LCSs. They’re solar-powered, which is super handy, and they measure PM2.5, temperature, and humidity every single minute. Before we sent them out into the world, we put them through rigorous calibration in the lab, comparing them to fancy reference instruments to make sure they were giving us accurate, reliable data. We even re-calibrated them periodically to keep them honest.
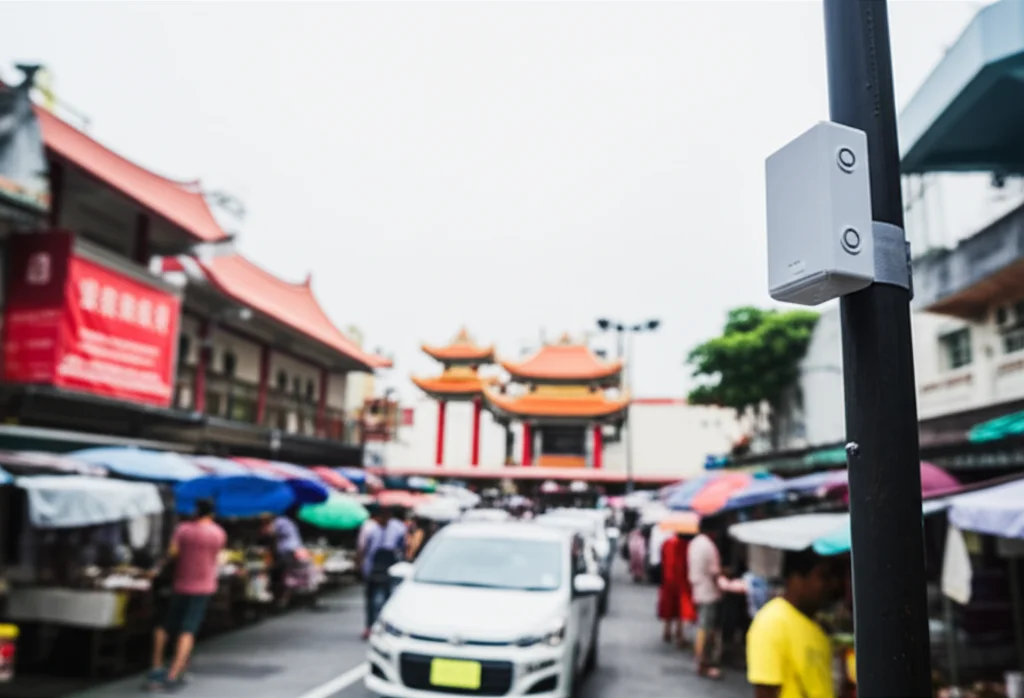
We deployed ten of these AS-LUNG-O sets back in 2017. Nine of them were strategically placed on street lamp posts, about 2.5 to 2.7 meters off the ground – that’s roughly pedestrian height! We put them near potential pollution sources like markets, vendors, busy traffic spots, and temples. The tenth sensor was placed much higher up, about 12.5 meters inside a school, to give us a reference point for the general ambient air quality, away from immediate street-level sources. We started collecting data in December 2017 and kept going until July 2021. That’s 3.5 years of continuous, street-level air quality data!
Now, keeping sensors out in the real world for that long isn’t without its challenges. We had to do regular checks and cleanings. A few sensors even had to be slightly relocated for safety reasons, but we made sure they stayed close to their intended monitoring spots. One sensor near a temple actually ran for the entire 3.5 years without a re-calibration, and guess what? It still showed good correlation with a nearby official monitoring station, proving these little guys can be quite stable!
We collected all this minute-by-minute data and crunched it into hourly averages. We also cleaned it up, removing data from rainy days (water messes with PM readings) and weird “ghost peaks” that might happen if a spider decided to build a web on the sensor inlet (yes, that happens!). We also pulled in meteorological data like wind speed and direction from a weather station at our high-level site, because weather plays a huge role in how pollution behaves.
What the Data Showed: Patterns and Peaks
After 3.5 years, we had a mountain of data! The average hourly PM2.5 concentration across all our street-level locations was about 24.3 µg/m³. Our high-level reference site was a bit lower, around 18.8 µg/m³, which makes sense – you’re closer to the action at street level!
We looked at the data in a few different ways:
- Seasons: Like many places, PM2.5 levels were generally higher during the colder months (November to April) compared to the warmer ones (May to October). This is often due to weather patterns that trap pollutants closer to the ground.
- Weekdays vs. Weekends: Interestingly, PM2.5 levels were slightly higher on weekends. Our guess? The influx of tourists bringing more traffic and activity to the area.
- Religious Events vs. Typical Days: This was a big one for this community. Days with major lunar festivals or the regular 1st and 15th days of the lunar month (when incense and paper money burning are common) showed significantly higher PM2.5 levels compared to typical days. This cultural practice clearly has a measurable impact on air quality across the community.
We also looked at the *maximum* PM2.5 levels recorded. While average levels were higher in winter and on weekends/religious days, the absolute highest peaks could happen pretty randomly, sometimes even on weekdays or typical days. This really highlights the value of long-term monitoring – you capture these unpredictable spikes that short-term studies might miss entirely.
To understand how much local sources added to the background pollution, we calculated the ratio of the daily maximum PM2.5 to the nighttime background level. On average, daily maximums were 30-50% higher than background levels, and sometimes even 60-80% higher during peak events! The location nearest a temple consistently showed the highest ratios, especially during warm seasons and religious events, indicating a strong local source influence.
Finding the Hotspots: Where Pollution Lingers
Using spatial analysis, we mapped out where the PM2.5 concentrations were highest – the “hotspots.” Unsurprisingly, locations near temples and markets frequently popped up as areas with elevated pollution. The location right next to a famous temple was almost always a hotspot, regardless of the day or season we looked at. Other spots near markets or busy traffic intersections also showed up as hotspots, though their intensity seemed to vary more depending on the time and day.
These maps really drove home the point that PM2.5 isn’t evenly distributed across a community. Local sources create pockets of higher pollution, and these pockets can shift depending on activities and even the weather.
Pinpointing the Culprits: Sources Revealed
To figure out *what* was causing these variations, we used a fancy statistical model that helps untangle the relationships between PM2.5 levels and different factors like weather, time of day/week/year, and nearby sources. The model confirmed what our hotspot analysis suggested:
- Religious Events: This was the most significant factor we identified. Burning incense and paper money during festivals and specific lunar days statistically significantly increased street-level PM2.5 across the community, not just right next to the temples.
- Vendors: Street vendors also contributed measurably to PM2.5 levels.
- Traffic: Both stop-and-go traffic and general vehicle emissions played a role, particularly at locations near busy roads or intersections.
- Meteorology: As expected, weather matters! Higher humidity was linked to higher PM2.5 (water droplets can carry particles), while higher wind speeds helped disperse pollution, leading to lower PM2.5. Wind direction also influenced where pollution drifted.
- COVID-19 Lockdown: This was a unique event during our monitoring period. We saw a significant drop in PM2.5 concentrations during Taiwan’s lockdown period in 2021, likely because many activities and emission sources were reduced. Our street-level sensors actually showed an even larger percentage decrease than what was reported by official ambient monitoring stations, suggesting the lockdown had a particularly strong impact on local, community-level sources.

Why Long-Term Matters: Beyond a Snapshot
One of the biggest takeaways from our work is the sheer value of sticking with it for the long term. Many previous community monitoring studies were short – maybe a few weeks or months. While they can capture specific events, they might miss the bigger picture or the unpredictable stuff.
Our 3.5 years of data allowed us to see consistent patterns across seasons and days, but also to capture those random, high-pollution events that wouldn’t show up in a short study. This means our data gives a much more *representative* picture of the air quality that residents are exposed to day in and day out, year after year. This kind of data is absolutely crucial for environmental health studies that look at the long-term impacts of air pollution on people’s health.
Comparing our long-term findings to a previous short-term study in the same community, we noticed that while the key sources (like religious events) were confirmed, the estimated contribution of those sources could look different. Short-term studies might capture a particularly intense event and overestimate the source’s *average* contribution over time. Long-term data smooths this out, giving a more realistic average exposure picture.
LCS: The Future of Monitoring?
Our study really demonstrates that research-grade low-cost sensors like our AS-LUNG-O sets are powerful tools. They aren’t meant to *replace* the super-accurate official monitoring stations, but they are fantastic *complements*. They can be deployed in networks to cover areas that traditional stations can’t, giving us that fine-grained view of air quality right where people live.
They’re also much more affordable to set up and run, especially when they’re solar-powered! This makes it possible for more communities, even those with limited resources, to start monitoring their air quality and identifying their specific pollution problems. Imagine citizen groups or local governments being able to pinpoint exactly which intersections, markets, or activities are causing the highest pollution levels in their neighborhood. That information is gold for developing targeted strategies to clean up the air.
Of course, they aren’t perfect. LCS data can have a bit more variability than traditional monitors, and they need regular maintenance (cleaning off those spiderwebs!). But the sheer volume of data you can collect over a long period helps to balance out some of that variability in statistical analysis.
The Takeaway: Breathing Better Together
So, what did we learn from our 3.5-year air quality adventure in this Asian community? We learned that PM2.5 levels fluctuate significantly based on seasons, days of the week, and especially cultural events like religious practices. We pinpointed specific hotspots, mainly around temples and markets. And we confirmed that local sources like religious burning, vendors, and traffic are key contributors to the air pollution people breathe at street level.
The COVID-19 lockdown gave us a clear, albeit temporary, demonstration of how reducing human activity can dramatically improve air quality.
Most importantly, we showed that long-term monitoring with research-grade low-cost sensors is incredibly valuable. It provides the kind of detailed, representative exposure data that environmental health researchers desperately need to study how air pollution affects us over time. It also gives communities and authorities the solid evidence they need to develop effective strategies to control pollution from local sources.
Our methodology is something that can be picked up and used in other communities around the world facing similar air quality challenges. Because ultimately, understanding the air we breathe is the first step towards making it healthier for everyone.
Source: Springer