
Brain Maps and Deep Tech: Spotting Early Alzheimer’s
Hey there! Let’s dive into something super important and, frankly, a bit mind-bending: how we might get a head start on spotting Alzheimer’s disease way, way early. You know, before things get really tough.
The Sneaky Challenge of Early Alzheimer’s
So, Alzheimer’s is the big one when it comes to dementia, right? And the tricky part? The changes in the brain can start happening *decades* before anyone even notices a symptom. That’s a massive window where things are shifting under the radar. Catching it early is key – it helps folks and their families prepare, manage symptoms better, and frankly, it’s crucial for testing out new treatments.
But here’s a snag: people in the early stages, or even those just *at risk*, are all over the map. Their brains show different subtle changes, maybe they have other health stuff going on, and it makes studying them as a group really challenging. Traditional ways of looking at this often lump everyone together, which can hide these important individual differences. We need something smarter, something that respects how unique each brain is.
Enter Normative Modelling: Your Brain’s Personal Report Card
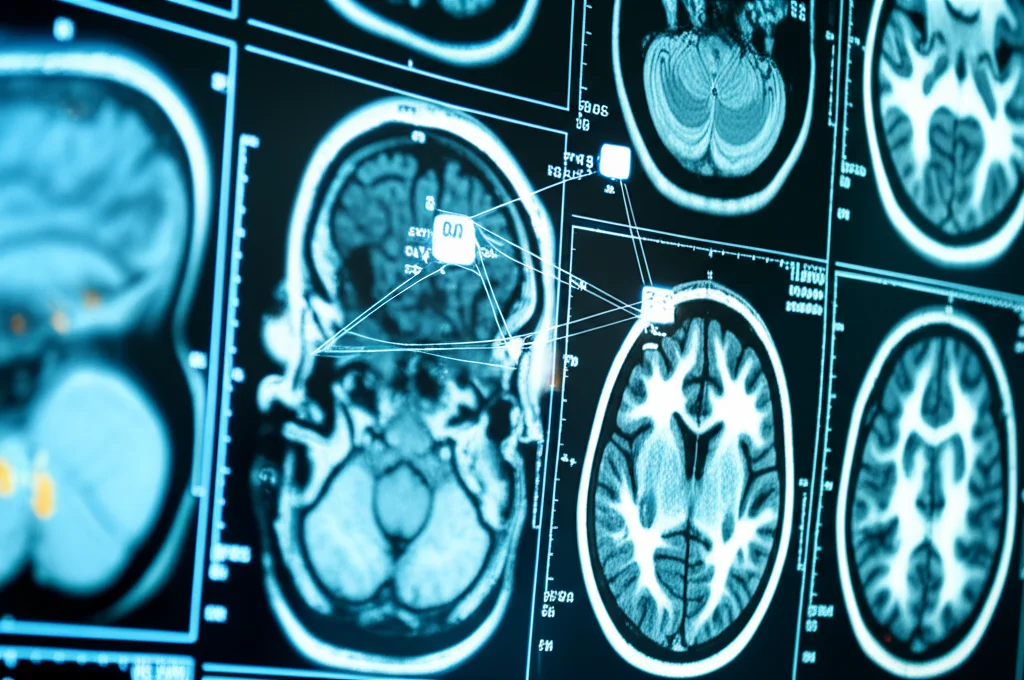
Imagine you want to know if your height or weight is “normal.” You wouldn’t just compare yourself to one friend, right? You’d look at charts showing the typical range for people your age and sex. Normative modelling is kind of like that, but for your brain using imaging data.
Instead of just saying “this brain looks different from a diagnosed AD brain,” it compares *your* brain’s features (like the size of different areas or the connections between them) to a statistical model built from *thousands* of healthy brains. It gives you a score – a “deviation” value – showing how much your brain measurements differ from what’s expected for someone like you (considering things like age and sex). It’s like getting a personalized report card saying, “Okay, for a healthy person your age, this part of your brain usually looks like X, but yours looks like Y, and that’s a Z amount of deviation.”
This is brilliant because it lets us look at individuals and see *their* specific pattern of difference, rather than just averaging everyone together.
Going Deep: Adding AI to the Mix
Now, traditional normative models often look at one brain feature at a time. But our brains are complex systems where everything talks to everything else! Deep learning, the fancy AI stuff, is great at finding complex patterns and interactions.
So, researchers have started using deep learning models, specifically things called autoencoders, for normative modelling. Think of an autoencoder as a super-smart compressor and decompressor for brain data. You train it on tons of healthy brain scans, and it learns the “normal” way all these different features fit together. When you show it a new brain scan, it tries to reconstruct it based on what it learned from healthy brains. The *error* in that reconstruction, or how much the new brain’s pattern deviates in the model’s internal “understanding” of normal, can be a powerful measure of abnormality.
What’s really neat is that these deep models can handle *multi-modal* data – meaning they can look at different types of brain scans (like structural MRI showing volume and Diffusion MRI showing connections) all at once, capturing a richer picture of the brain’s state.
Putting it to the Test: UK Biobank Meets EPAD
Okay, so how did they actually do this? The team behind this study used a massive dataset called the UK Biobank, full of imaging data from healthy folks, to train their deep normative model. This taught the model what a “normal” brain looks like across a wide range of ages.
Then, they took this trained model and applied it to a different group: the EPAD cohort. This is a super interesting group because none of them had been diagnosed with dementia yet, but they were chosen because they represented a spectrum of risk for developing Alzheimer’s. Perfect for looking at those really early, subtle changes! They used structural MRI (T1) and Diffusion MRI (dMRI) features from these individuals.
The goal was to see if this deep normative model could pick up subtle differences in the EPAD group that might relate to AD, even before symptoms were obvious.
What Did They Find? The Deviations Tell a Story
They looked at a couple of ways to measure deviation:
1. Aggregate Deviation (Dml): A single number summarizing how much the *whole brain pattern* deviates from the norm.
2. Regional Deviation (Duf): A score for *each specific brain region*, showing its individual deviation.
Turns out, the aggregate deviation (Dml) was pretty telling! Even in this group of non-demented individuals, higher Dml scores correlated significantly with measures of cognitive ability (like scores on memory/thinking tests) and certain biological markers linked to AD in spinal fluid. This is promising – it suggests a general measure of “brain weirdness” (in the nicest possible way!) can flag individuals who might be on the AD path. It means you don’t *have* to know exactly which brain regions are affected by AD beforehand; the model can still find relevant differences.
But the regional deviations (Duf) were even more sensitive when they focused on areas known to be hit hard by AD, like the hippocampus (that crucial memory area). Deviations in the hippocampus showed even stronger links to those AD biomarkers and cognitive scores compared to the general Dml score, or even just looking at raw hippocampus volume. This tells us the model, even though trained on healthy brains, becomes extra insightful when you zoom in on vulnerable spots.
Mapping the Differences: Where Deviations Show Up
The researchers also created “outlier maps” based on the regional deviations (Duf). They looked at which brain regions showed significant deviations in individuals grouped by their cognitive performance (from perfectly normal to slightly impaired).
And guess what? As cognitive scores went down, the proportion of individuals showing deviations in certain brain regions went *up*. The areas that popped up as having the most deviations were exactly the ones we’d expect in early AD – particularly in the temporal lobes, including the hippocampus and parts of the limbic system. This really validates that the deviations the model finds are biologically relevant to AD.
Genetic Risk and Deviations
They also peeked at how genetic risk, specifically carrying the ApoE ε4 gene (a big risk factor for AD), related to these deviations. Interestingly, the overall aggregate deviation (Dml) didn’t show a significant difference based on ApoE status at baseline (when everyone was cognitively normal).
However, when they looked at the *regional* deviations (Duf), they found something fascinating: individuals with two copies of the ε4 gene showed significant *shrinkage* (more negative deviation) in regions like the hippocampus and entorhinal cortex compared to those without the gene, *even though they were all cognitively normal at that point*. This is huge! It suggests this method might detect very early structural changes linked to genetic risk before any cognitive symptoms appear.
Watching Deviations Grow Over Time
Perhaps one of the most compelling findings came from looking at a smaller group who had brain scans 12 months apart. They compared the aggregate deviation (Dml) at baseline and after a year in the ‘at-risk’ group versus a ‘super healthy’ control group.
The result? The ‘at-risk’ group showed a statistically significant *increase* in their overall brain deviation over just 12 months. The ‘super healthy’ group? Their deviation stayed stable. This is incredibly promising because it suggests these deviation metrics might not just identify individuals at risk, but could also be used to *monitor* whether their brain is changing over time, potentially tracking disease progression even in the very early stages.

The Big Picture: Why This Matters
So, what’s the takeaway from all this?
* Deep normative modelling is a powerful tool for looking at individual brains and quantifying how they differ from a healthy pattern.
* Even general measures of deviation from this norm can pick up subtle differences related to AD in people who aren’t yet diagnosed.
* When you focus on AD-vulnerable regions, the sensitivity increases.
* The patterns of deviation seen align with known AD pathology – showing up in the right brain regions as cognitive decline starts.
* It might even detect very early structural changes linked to genetic risk before symptoms appear.
* Crucially, these deviation scores seem to *increase* over time in people at risk, suggesting they could be used to track progression.
This study really highlights the potential of these methods for catching AD incredibly early and potentially monitoring how it progresses. And because the normative model isn’t specifically trained *on* AD, this approach could potentially be adapted to look for early signs of other brain disorders too. Pretty exciting stuff, if you ask me!
A Few Caveats (Science Always Has Them!)
Of course, no study is perfect. The researchers noted a few limitations, like the training data potentially including some people with very early, undetected changes, the limited size of some subgroups in the EPAD data, and the fact that the longitudinal look was only over 12 months. Future work with larger, longer-term datasets will be key to building on these findings.
But overall, this work gives us a really hopeful glimpse into the future of brain health – one where we might be able to spot trouble brewing much earlier, giving us a better chance to intervene.
Source: Springer