Beyond the Calendar: How AI and DXA Scans Reveal Your Body’s True Age
Hey there! Ever feel like your body is on a different timeline than your birth certificate? You know, some folks seem sprightly and healthy way past their years, while others face health hurdles surprisingly early. Turns out, that number on your ID – your chronological age – isn’t always the best predictor of your health future. And honestly, that makes a lot of sense, right? We all age differently.
This got scientists thinking: what if we could measure our *biological* age? Not just how many years we’ve been around, but how our body is actually functioning, how “worn” it is. This biological age concept is pretty neat, and lots of smart folks have been trying to figure out reliable ways to measure it. We’ve seen ideas using genetics, blood tests, even brain scans.
But here’s the rub: a lot of these methods can be complicated, super expensive, or just don’t give us clear, actionable insights. Like, knowing your genes *might* tell you something, but it doesn’t necessarily tell you *what to do* about it in a practical, everyday way. We need something more accessible, more affordable, and something that gives us clues about *why* our biological age might be different from our calendar age.
Body Composition: A Hidden Clue?
So, where else can we look? Well, let’s talk about body composition – basically, how much fat and muscle we’re carrying around, and where it’s all located. Recent studies have really highlighted that how our bodies are built, especially the distribution of fat and muscle, is closely linked to all sorts of chronic diseases. Think about conditions like diabetes, heart disease, and metabolic issues. It seems like where you store fat, particularly around your organs (visceral adipose tissue, or VAT), and how much lean muscle you have, are big players in your health story.
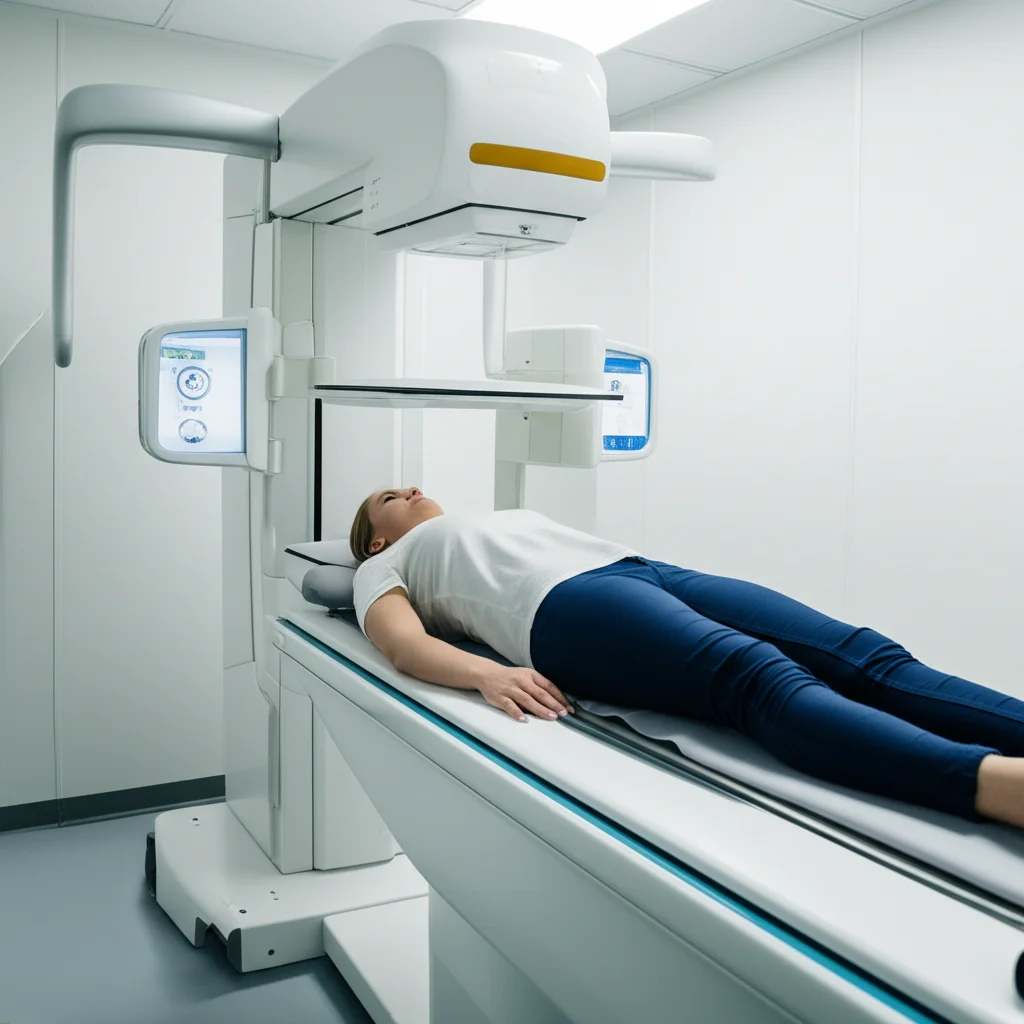
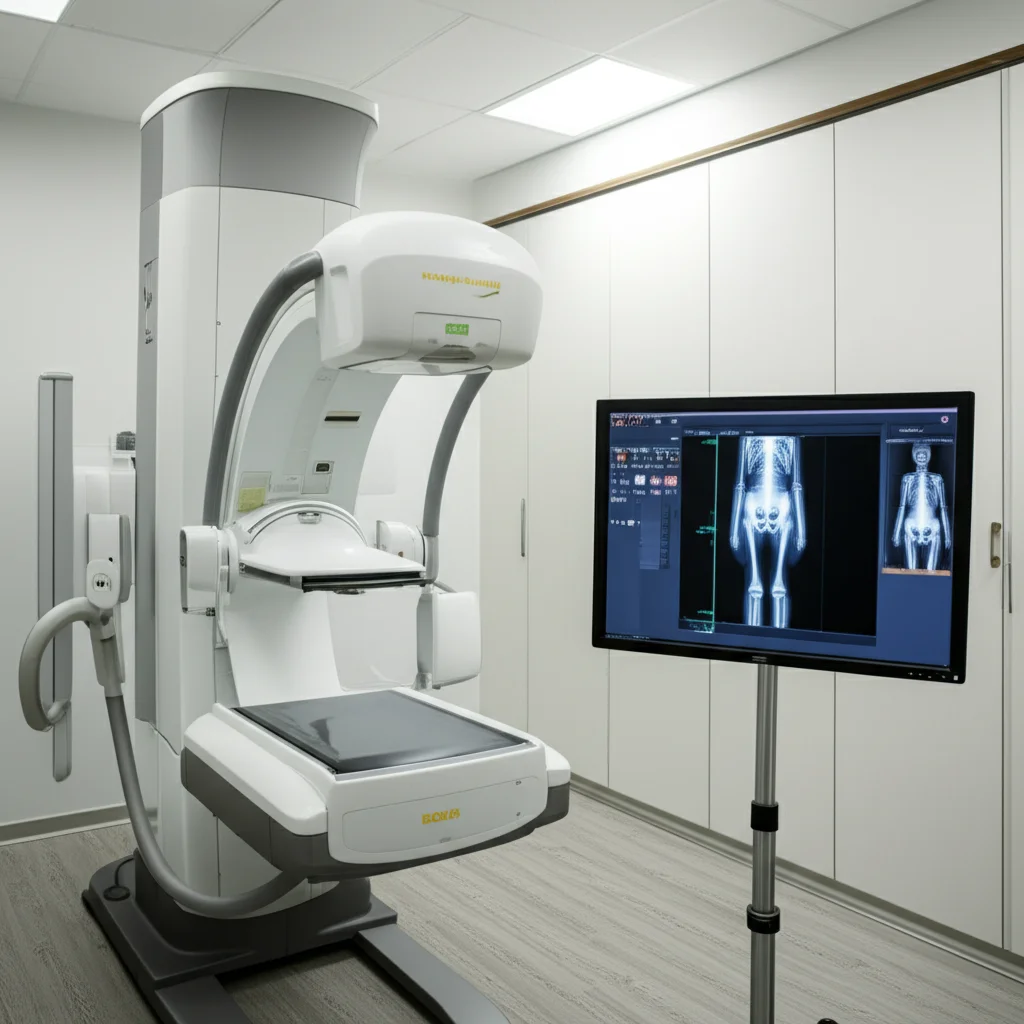
Measuring body composition accurately can be done in a few ways. MRI is the gold standard, but wow, is it expensive and time-consuming. Bioelectrical impedance (those scales that send a tiny current through you) is easy and cheap, but not always the most precise. Then there’s Dual-energy X-ray Absorptiometry, or DXA. You might know it from bone density scans, but it’s also fantastic at measuring body composition. It’s accurate, relatively quick, and more accessible than MRI. This makes DXA data a really promising candidate for a widely usable health biomarker.
Enter Deep Learning
Now, DXA scans give us detailed images and numbers about fat and muscle. But how do we turn that raw data into a meaningful measure of biological age? This is where deep learning comes in. Deep learning is a type of artificial intelligence that’s brilliant at finding complex patterns in data, especially images. Scientists have already used it successfully with other medical images like MRIs and X-rays to estimate biological age. But applying it specifically to DXA scans for body composition aging? That hadn’t really been explored much on a large scale.
So, the brilliant minds behind this study decided to tackle this gap. They thought, “What if we could train a deep learning model using DXA scans to estimate a ‘Body Composition Biological Age’ (BCBA)?” The idea was that for people who are aging typically and are generally healthy, their BCBA should be pretty close to their chronological age. But for people who are facing health challenges or have body compositions that aren’t typical for their age, their BCBA might be significantly *older* than their calendar age.
Building the BCBA Model
To do this, they needed a massive amount of data, and the UK Biobank came to the rescue. This is a huge database containing health information, including DXA scans, from half a million people in the UK. The researchers carefully selected a group of participants from the UK Biobank. They focused on individuals of Caucasian ethnicity (a limitation they acknowledge, aiming for future diversity), ensuring gender consistency, and excluding anyone with a history of cancer, as these factors could mess with body composition.
From this pool, they defined a “normal reference group” – basically, people whose VAT and lean mass were within a typical range (one standard deviation from the mean) for their age and sex. They assumed that for these folks, their biological age based on body composition should roughly equal their chronological age.
They then trained a sophisticated deep learning model, specifically a DenseNet-121, using the DXA images from this normal reference group. The model learned to predict the chronological age of these healthy individuals based purely on their body composition scan. The magic here is that by training on “normal” aging patterns, the model essentially learns what a typical body composition looks like at different ages. When you then feed it a scan from someone *outside* this normal group, the difference between the model’s predicted age (the BCBA) and the person’s actual chronological age gives you an indication of whether their body composition is aging faster or slower than expected.
They also identified groups with pre-existing diseases (diagnosed before the scan) and those who developed diseases after the scan. This allowed them to test if the BCBA could not only indicate current health status but also predict future disease risk.
What the Scans Revealed: Sex-Specific Aging
One of the really important aspects of this study is that they analyzed men and women separately. Why? Because, as anyone who’s ever compared body shapes knows, men and women tend to have very different body compositions! We store fat and build muscle in different places, and this study confirmed that. Men generally had higher VAT and lower lean mass percentages than women in the study groups, and men also had a higher prevalence of the diseases studied. This significant difference means a “one-size-fits-all” approach to body composition aging just wouldn’t work. The BCBA model needed to be sex-specific.
When they ran the trained model on different groups, the results were quite telling. For the normal reference group, the BCBA was indeed close to their chronological age. But for groups with atypical body composition or pre-existing diseases, the BCBA tended to be significantly *higher* than their chronological age. This suggests their bodies, from a composition standpoint, were aging faster. Conversely, a “hypernormal” group (lower VAT, higher lean mass) showed a BCBA lower than their chronological age – perhaps indicating “decelerated” aging in terms of body composition.
They also used a cool technique called saliency mapping to see *which* parts of the DXA scan the AI model was paying most attention to when calculating the BCBA. And guess what? The “hot regions” – the areas most influential for the BCBA prediction – were different for men and women, and different between healthy and diseased groups.
- In healthy women, the pelvis and lower abdomen were key.
- In healthy men, the chest region was more prominent.
- In women with disease, hot regions spread throughout the upper body.
- In men with disease, the chest and lower abdomen became more emphasized.
This aligns with what we know about how fat distribution affects health differently in men and women, particularly concerning cardiovascular risk.
BCBA as a Health Predictor
The big question is: can this BCBA actually predict disease risk? The answer from this study is a resounding *yes*. They found a strong positive association between a higher BCBA (specifically, the difference between BCBA and chronological age) and the likelihood of having or developing:
- Type 2 Diabetes (T2DM)
- Major Adverse Cardiovascular Events (MACE – things like heart attacks and strokes)
- Atherosclerotic Cardiovascular Disease (ASCVD – hardening of the arteries)
- Hypertension (high blood pressure)
For every unit increase in the BCBA-CA difference, the odds of having these diseases went up significantly, for both men and women (though the exact odds ratios varied slightly by sex). This is pretty powerful stuff! It means that if your BCBA is, say, 10 years older than your chronological age, you’re statistically more likely to face these health issues.
Outperforming Traditional Methods?
Here’s where it gets even more exciting. The researchers compared the BCBA’s predictive power against traditional cardiovascular risk factors (like age, blood pressure, BMI, waist/hip circumference, smoking). For predicting MACE and ASCVD, the BCBA model (using only BCBA and the BCBA-CA difference) actually outperformed models using these traditional factors, and also outperformed models using just the raw VAT and lean mass data from DXA.

The *best* prediction came from combining the BCBA with the traditional risk factors. This suggests that BCBA isn’t just replacing existing methods; it’s *adding* valuable, complementary information that gives us a more complete picture of someone’s health risk.
They also showed that simply stratifying people into “low risk” (BCBA CA) groups based on BCBA significantly differentiated their likelihood of experiencing these diseases over time. This makes BCBA a practical tool for identifying individuals who might benefit from earlier or more aggressive preventive strategies.
The Potential and the Path Forward
So, what does this all mean? It means we might be on the cusp of having a widely accessible, relatively affordable, and powerful new biomarker for assessing chronic disease risk and tracking how our bodies are aging. Integrating something like BCBA into routine health check-ups using standard DXA scans could help doctors identify people at high risk *before* they develop serious problems, allowing for more personalized interventions. Imagine getting a “body age” report along with your other test results, giving you a clearer picture of where you stand and motivating you to make changes.

Of course, like any new scientific finding, there are limitations and next steps. This study was based on data from people of primarily Caucasian ethnicity, so we need to see if the BCBA works just as well for other racial and ethnic groups. They also only looked at four specific diseases; future work could explore its link to things like cancer or dementia. Plus, the current “normal” group was defined by human criteria; they’re hoping to develop more automatic, data-driven ways to do this in the future. And crucially, while the results are strong, they need to be validated in independent datasets and through prospective studies (following people over time *after* their scan) to truly confirm its real-world predictive power.
Despite these steps ahead, this research is a really exciting leap. By combining accessible technology like DXA with the power of deep learning, we’re getting closer to understanding and measuring our biological age in a way that could genuinely improve public health and help us live healthier, longer lives.
Source: Springer