
Automating Flow Cytometry: The Smart Way to Analyze Your Data
You know, if you’ve ever spent hours hunched over flow cytometry data, manually drawing gates to identify cell populations, you know the drill. It’s essential work, sure, but let’s be honest – it can be incredibly time-consuming, a bit subjective, and sometimes, frankly, a real drag. Accounting for tiny shifts and variations between samples? That’s where the real headache begins, often introducing inconsistencies.
For ages, the standard approach has been this manual gating process on bivariate plots or histograms. You define a strategy, maybe batch process, but you still have to visually check *everything* because biological and technical variability means those populations don’t always sit in the exact same spot. It’s slow, prone to user variability, and can impact how accurate and repeatable your results are, especially with tricky data like continuously expressed markers or complex gating strategies.
Automated analysis has been the dream, right? Lots of smart folks have been working on it, using clustering algorithms or trying to mimic manual gating statistically. But the big hurdle? Getting the automation to handle that file-to-file variability and adjust gates locally, just like an expert analyst would. Existing tools often struggle with standardization or don’t quite match the performance of a seasoned pro. There’s been a real need for something objective, consistent, and automatic that uses your existing gating strategy but is also super easy for folks who aren’t coding wizards.
Enter ElastiGate: A New Approach
So, we thought, “What if we could teach a computer to see the data like an analyst does?” That’s the core idea behind BD ElastiGate Software – or just ElastiGate, as we like to call it. Instead of relying purely on clustering or density peaks, which can be rigid, we took inspiration from how manual gating is essentially visual pattern recognition.
The magic happens by treating your flow cytometry plots – those 2D scatter plots and histograms – like images. Yes, images!
How the Magic Happens (Simply Put)
Here’s the cool part: ElastiGate uses something called elastic image registration. Think of it like this: you have a “training” plot where you’ve already drawn your gates perfectly, and then you have a new “target” plot with similar data, but everything’s shifted around a bit. Elastic image registration figures out how to *warp* or *stretch* the training image to match the target image. It’s like aligning two slightly distorted photos.
Once it knows how to warp the image, it applies that *exact same warping* to your gate boundaries (the vertices). This means your gates automatically adjust to follow those local shifts and variations in the new data, maintaining the cutoffs you intended. No assumptions about population shapes, no fiddling with peak finding or density cutoffs. It’s designed to be flexible and follow the data’s flow.
We built ElastiGate to be accessible, releasing it as a plugin for the widely used FlowJo Software and also in BD FACSuite Software. The goal was to put this power in the hands of biologists and technicians, not just computational experts. You can even review and tweak the gates afterward if you need to.
Putting ElastiGate to the Test
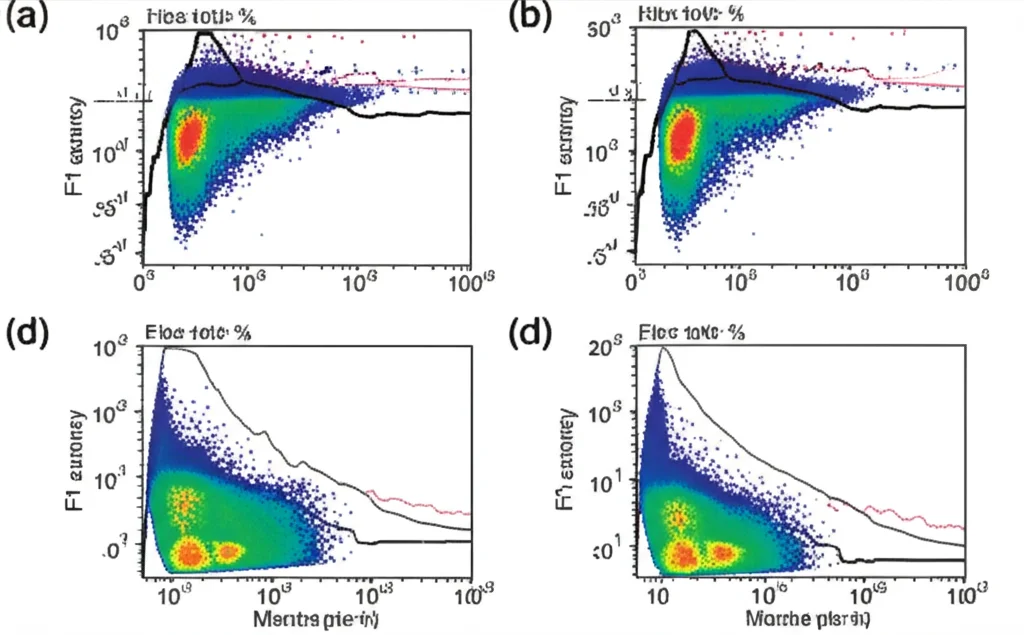
We didn’t just build it and hope for the best. We put ElastiGate through its paces with a bunch of real-world flow cytometry datasets, varying in complexity and difficulty. We compared its gating accuracy against manual gating done by multiple experts using F1 score statistics – a way to measure how well the automated gates matched the manual ones (our “ground truth”).
We started with some benchmarking datasets, like identifying basic blood cell populations (lymphocytes, monocytes, granulocytes) based on scatter profiles. This dataset was tricky because the sample processing caused variability, making it perfect to see if ElastiGate could adapt to local changes. Using just *one* manually gated sample as training, ElastiGate tracked the shifting populations almost identically to expert manual analyses. Even for populations that were harder to define or had low cell counts, the median F1 scores were really high, mostly > 0.9.
We also tested it on fluorescence quantitation beads – those little beads used to calibrate instruments. Gating these can be tedious with minor shifts. ElastiGate nailed it, handling multiple histogram gates and compensating for shifts among samples with median F1 scores of 0.991 across all gates, very similar to manual experts.
Then came the monocytes – a tougher challenge because they don’t always have simple, clear-cut expression patterns. We used a dataset with multiple fluorescence parameters and varied processing conditions. Again, using just one training sample, ElastiGate applied to nine gates over seven plots. Median F1 scores were all > 0.93, comparable to other analysts. This highlighted how manual gating can sometimes introduce subjectivity, which ElastiGate helps prevent through standardization.
Real-World Applications: CAR-T, TILs, and High-Throughput Screening
Beyond benchmarking, we validated ElastiGate with biologically relevant datasets:
* CAR-T Cell Manufacturing QC: Cell therapy manufacturing needs rigorous QC. Patient variability means manual review is often needed for each sample. We tested ElastiGate on samples from incoming leukapheresis and final CAR-T products. Using just a few training files (3 for apheresis, 1 for final product), ElastiGate performed incredibly well, with median F1 scores over 0.99 across all gates, matching or even slightly exceeding manual analysts.
* Tumor-Infiltrating Lymphocyte (TIL) Immunophenotyping: TIL samples are notoriously difficult – low cell numbers, debris, varying cell states. Manual gating is time-consuming and requires expertise. We used a complex 14-color panel. Here, we found a recursive approach worked best: start with a few training files, see where the algorithm struggles, manually gate those tricky samples, and add them to the training set. With six training files, ElastiGate achieved median F1 scores > 0.935, performing similarly to four expert analysts.
* High-Throughput Cytotoxicity Assays: Screening drug compounds can involve thousands of samples. Manual analysis is simply not feasible at that scale. We tested ElastiGate on 440 samples from a high-throughput assay with substantial variability. Again, using a recursive approach and ending up with 15 training files, ElastiGate’s F1 scores were comparable to six manual expert analysts, mostly > 0.96.
Faster, Faster, Faster!
Accuracy is great, but speed is where ElastiGate really shines compared to manual gating. Across all the datasets we tested, the time reduction was dramatic – anywhere from about 3-fold to a whopping 60-fold! On average, it took about 6 seconds per FCS file, though more complex, high-parameter datasets took a bit longer (~60 seconds per file). This processing happened on standard laptops, proving you don’t need super-fancy hardware. It drastically cuts down analysis time while making things more objective.
How Does It Stack Up Against the Competition?
We also compared ElastiGate to a couple of other automated 2D gating solutions: flowDensity (a popular density-based R package) and Cytobank Automatic gating (a proprietary tool). We used a subset of the high-throughput cytotoxicity data.
Here’s what we saw:
- For populations with clear, well-defined clusters (like bimodal distributions), ElastiGate and flowDensity had comparable F1 scores.
- However, for gates with less clear separation or continuously expressed markers, flowDensity’s scores were significantly lower. We saw cases where flowDensity misclassified apoptotic cells as live or incorrectly placed gates for populations showing downregulation.
- Cytobank Automatic gating performed similarly to flowDensity, also struggling with populations that weren’t clearly defined and lacking the ability to manually adjust gates after automation.
In our hands, ElastiGate generally outperformed both flowDensity and Cytobank Automatic gating, not just in accuracy for complex populations but also in usability. FlowDensity requires coding expertise, and neither flowDensity nor Cytobank allowed easy manual adjustment of the automated gates.
Handling High-Parameter Data
Flow cytometry is getting more complex, with spectral flow enabling analysis of up to 50 markers! This creates massive gating strategies with tons of plots. We tested ElastiGate on a 38-color panel. Using just 3 training files from healthy donors, ElastiGate’s accuracy (F1 score) was equal to or better than three manual analysts across 49 gates. Even with samples that varied (fresh, frozen, fixed), ElastiGate adapted well. This shows ElastiGate can scale to handle high-dimensional data automation with minimal training.
Designed for You
One of the key goals was to make ElastiGate easy to use. It has a graphical user interface (UI) in FlowJo and FACSuite with minimal, intuitive parameters. You define your gating strategy manually on training samples in the main software, then use the ElastiGate plugin UI to select training and target files. It’s designed so scientists with minimal training and no coding experience can use it effectively.
Selecting the right training samples is crucial – they should represent the main phenotypes and variability in your dataset. For simple cases, one file might be enough. For complex assays, a few representative samples covering different conditions (controls, treated, high/low expression) are best. We found that an iterative process – run ElastiGate, see which samples need better gating, manually gate those, and add them to training – works really well for complex datasets.
While ElastiGate is powerful, it’s not magic. It assumes gates should maintain their relative position to data densities. In very sparse areas, it might struggle to distinguish data from noise. It also doesn’t currently support Boolean gates or FMO workflows directly within its automation step. And while it handles 1D and 2D plots, it’s designed to automate the conventional manual gating process, not explore higher dimensions directly. Lower F1 scores are more common for populations with very low cell counts (< ~100), partly because F1 scores are sensitive to misclassification when numbers are small, and partly because modeling shifts in sparse data is harder. But even then, you can focus your manual review on just those tricky, low-count gates, saving time on the rest.
The Bottom Line
ElastiGate is a serious game-changer for automating flow cytometry gating. It offers accuracy comparable to expert manual gating across a wide range of assays and instruments, even with significant experimental or biological variability. By converting plots to images and using elastic registration, it adapts to local data shifts in a way that traditional methods often can’t.
It dramatically reduces analysis time (3x to 60x faster!), makes gating more objective and consistent across samples and operators, and is accessible to biologists without needing coding skills. While there are some limitations, especially with very sparse populations or specific gate types, the ability to use minimal training samples and refine the process iteratively makes it incredibly practical for complex strategies and high-throughput screening. It’s a tool that really helps you get to your results faster and more reliably.
Source: Springer