Seeing Clearly: How AI is Automating Stenosis Measurement in Bronchoscopy
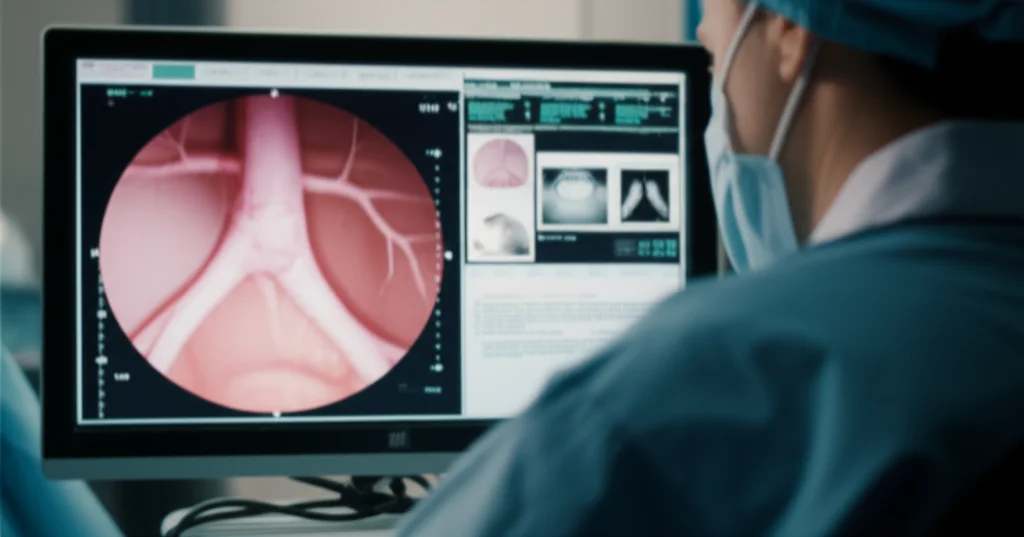
Hey there! Let me tell you about something pretty cool happening in the world of medicine, specifically when folks need a look inside their airways. We’re talking about bronchoscopy, that procedure where doctors use a flexible tube with a camera to peek around. It’s super important for diagnosing things like subglottic stenosis, which is basically a narrowing in your windpipe just below the vocal cords.
Now, figuring out *how much* that airway is narrowed is key. Traditionally, doctors either look visually during the bronchoscopy – which, let’s be honest, can be a bit subjective, right? What one expert sees might be slightly different from another. Or, they use CT scans, which are more objective but mean more radiation exposure for the patient, especially if they need monitoring over time. Neither option is perfect for everyone, every time. We thought, “Surely, there’s a way to make this more consistent and less burdensome?”
The Problem with the Old Ways
So, yeah, the visual estimation during a bronchoscopy? It’s like trying to guess the size of a coin just by looking through a straw. Experts do a fantastic job, but human eyes aren’t always perfectly calibrated measuring tapes. Studies have even shown that visual assessments can sometimes misclassify the severity, often underestimating it. That’s not ideal when you’re trying to figure out the best way to help someone breathe easier.
CT scans give you a great, objective picture, like a detailed blueprint. But if a patient needs regular check-ups to see if the stenosis is getting better or worse, repeated CT scans mean repeated doses of radiation. We really wanted to find a way to get that objective measurement *without* the radiation, right there during the bronchoscopy itself.
Enter the Automated Solution
This is where we come in with something pretty neat. We’ve developed a pipeline – think of it like a step-by-step automated process – that can estimate the severity of subglottic stenosis directly from the bronchoscopy video. And here’s the really cool part: it does this *without* the doctor having to push the scope *through* the narrowed section, which can sometimes be tricky or uncomfortable.
Our goal was to create a tool that’s automated, consistent, and can just slot into the existing bronchoscopy procedure. No extra hardware, no complicated new training needed for the docs. Just smarter use of the video feed they’re already getting.
How Does This Magic Happen?
Okay, so how do we pull this off using just the video? It all comes down to a clever trick using the light from the bronchoscope. In endoscopy, because the camera and light source are together, the way the light fades tells you something about depth. We exploit this “illumination decline” effect.
Here’s the simplified rundown:
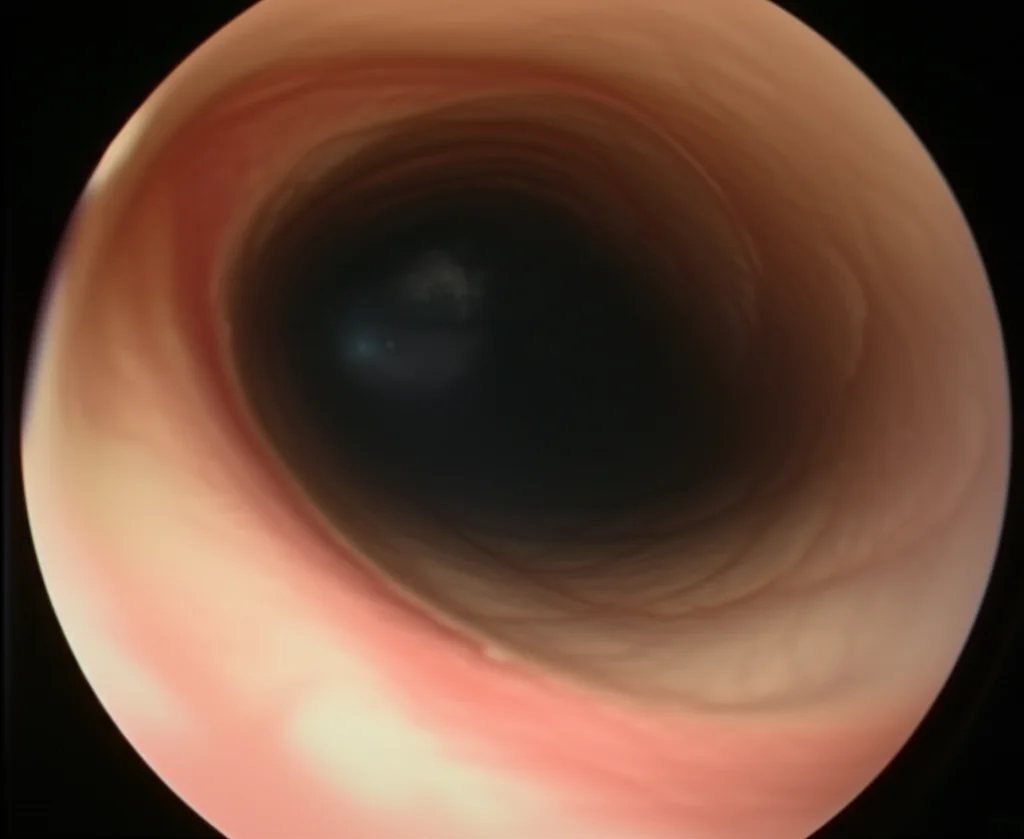
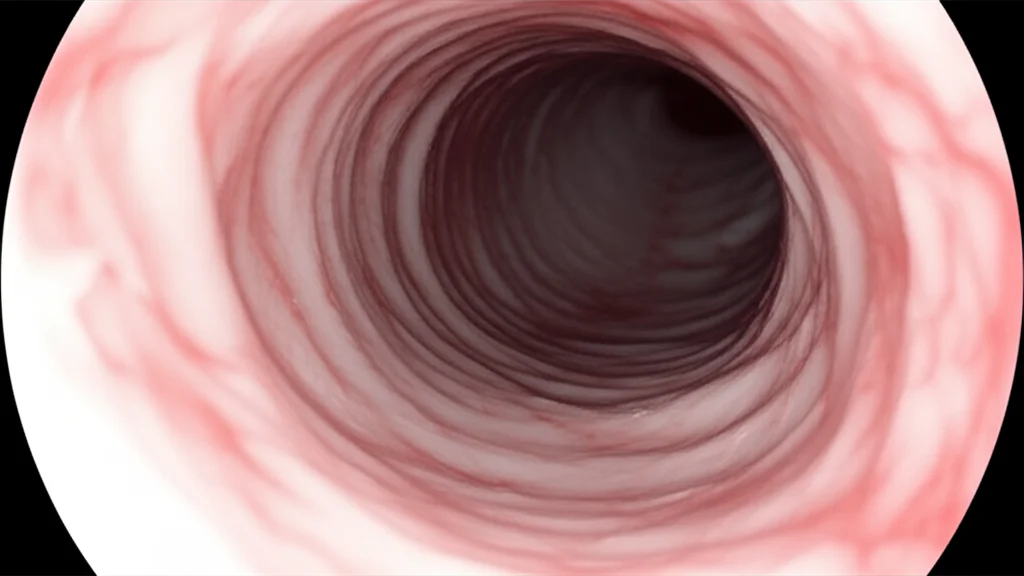
- First, our system watches the video as the scope goes in. It’s looking for the darkest area, which is usually the open airway (the lumen).
- It segments and tracks this dark area.
- When the scope passes the vocal cords and starts approaching the stenosis, the shape of that dark area changes significantly. This tells our system, “Aha! We’re in the right spot!” It selects this moment as the “keyframe.”
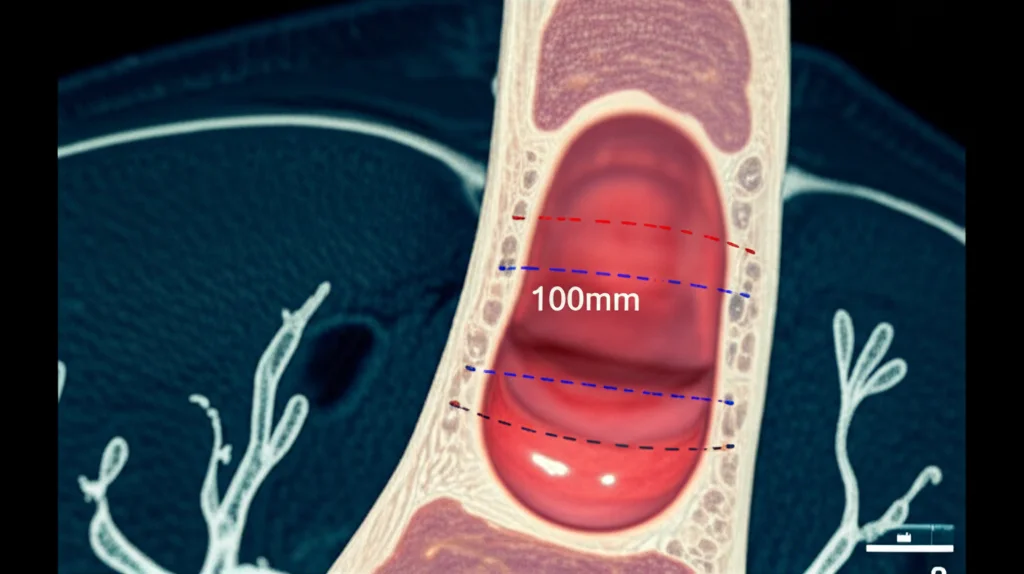
- Using that keyframe and the illumination decline information, we build a 3D model of the airway section right there.
- From this 3D model, we can precisely measure the area of the narrowed section and compare it to a healthy reference area nearby (specifically, the widest part just after the vocal cords but before the stenosis). This gives us the percentage of narrowing.
It’s like taking a single photo and using the shadows and light to build a little 3D replica of the airway section, then taking measurements from that replica. Pretty slick, right? This approach is actually the first time anyone has shown you can use illumination decline this way for 3D reconstruction in bronchoscopy to measure stenosis.
Why This Matters
The potential impact of this is quite significant. By automating the measurement, we can drastically reduce the subjectivity that comes with visual estimation. This means more robust and consistent diagnoses. For patients, it could mean less time under sedation during the procedure (because the measurement is quick and automated) and potentially fewer CT scans needed for monitoring, saving them from radiation exposure.
For physicians, it provides a standardized tool to assist their diagnosis and monitor how a patient’s condition is changing over time. It integrates easily into their existing workflow. Plus, the measurement itself is fast – we’re talking seconds on a good GPU.
Another big deal? We’re releasing the dataset we used to develop and test this. It’s called the Subglottic Stenosis Dataset, and it includes real bronchoscopy videos, plus ground-truth measurements from CT scans and expert visual estimations. Making this public is super important because it lets other researchers build upon our work and hopefully develop even better tools down the line.
Putting it to the Test
We didn’t just build this and say, “Trust us!” We put it through its paces using our new dataset from real patient procedures. We compared our automated measurements to the ground truth from CT scans and to the estimations made by experts. The results were really promising – our estimations were consistent with both.
We also checked for repeatability. If we ran the analysis on different videos of the same patient (taken under similar conditions), did we get similar results? Yep! Our pipeline showed consistency comparable to the variability you might see between different expert visual estimations.
We even compared our method for selecting that crucial “keyframe” to other approaches using fancy segmentation models like SAM. Our simple, intensity-based method for finding the darkest area actually performed better, consistently selecting the correct frame interval. Statistically speaking, our results weren’t significantly different from the ground truth or expert estimates, which is exactly what you want to see!
What’s Next?
Now, like any new technology, it’s not *perfect* yet. We did notice that our method tends to slightly underestimate the stenosis severity compared to some clinical classifications. Also, the spot where we measure the “healthy” reference area (just after the vocal cords) is different from where the standard clinical Myer–Cotton classification typically measures it (after the stenosis in the trachea).
So, future work will definitely involve gathering more data, especially data that’s been carefully supervised by experts, to help calibrate our system better. We want to validate our approach against that standard Myer–Cotton classification and work on correcting that slight underestimation.
But even with these points to address, we’re really excited about what this means. It’s a solid first step towards using 3D geometric information derived from standard bronchoscopy video to make stenosis assessment more objective, faster, and ultimately, better for patients and the medical teams caring for them. It feels good to be part of paving the way for these kinds of advancements!
Source: Springer