Diving Deep: What Current Does to Aquaculture Nets (And Why It Matters!)
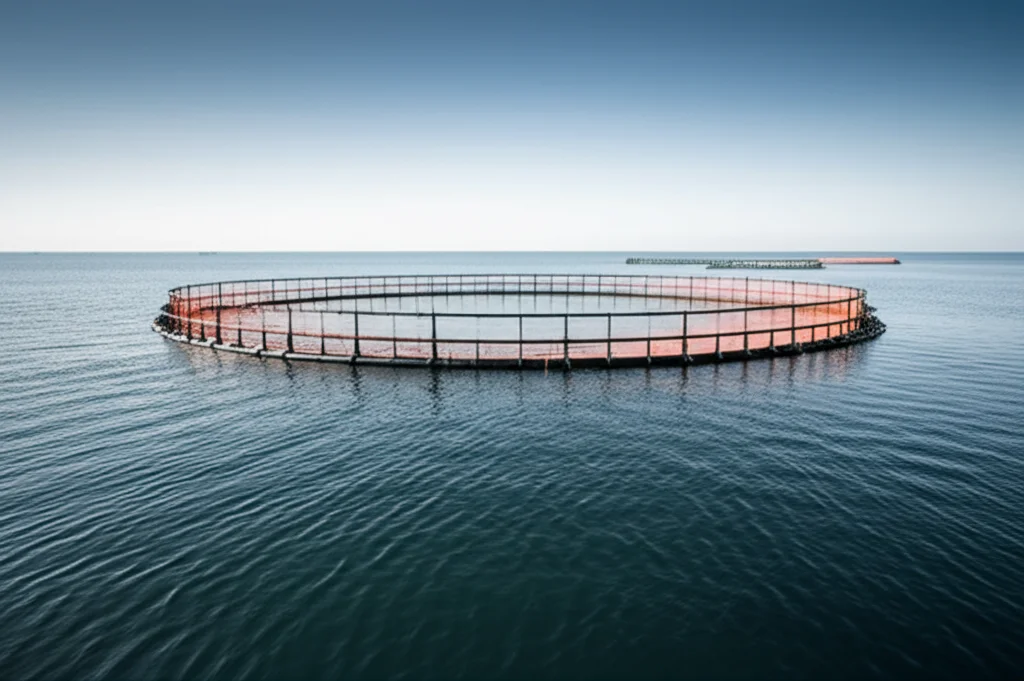
Hey there! So, you know how important fish farming, or aquaculture, is becoming for feeding the world? It’s huge! Seriously, it’s growing way faster than the human population, especially in places like Asia. And one of the most common ways we do this is with net cages out in the water. But have you ever stopped to think about what the ocean current is doing to those nets?
It turns out, the force of the water pushing against the net – what we call ‘drag’ – is a massive deal. Like, 85% of the total force on the whole cage structure comes from the net! And here’s the kicker: if the water speed just changes a little bit, the force on the net changes a *lot* because it’s proportional to the square of the velocity. Yikes! So, understanding this interaction between nets and currents isn’t just academic; it’s absolutely critical for making sure these cages are safe and actually work the way they’re supposed to.
Nets hanging out underwater are constantly battling the flow. Things like how deep they are, how fast the current is, local water movement, oxygen levels, and even how ‘solid’ the net is (basically, how much of the area is blocked by netting) all play a role. The water flow *inside* the cage is a whole other ballgame, influenced by the incoming current, how it hits the net, and even the fish swimming around in there!
Because of all this, we really need to get a handle on how different factors change the loads on these nets. People have been experimenting for decades to figure this out. Back in the day, folks were looking at how turbulence behind screens affected drag. More recently, we’ve learned that nets with higher solidity ratios (more netting, less open space) have more drag. And biofouling – you know, when stuff grows on the nets? That can increase drag *massively*, like ten times more than a clean net!
Exploring Different Net Types and Materials
Most early studies focused on nets with square holes, but researchers have also looked at diamond-shaped meshes. Turns out, the shape makes a difference! Even the material matters. Some studies checked out copper alloy nets and found they had lower resistance than traditional ones. Others investigated polyethylene (PE) and polyamide (PA) nets, looking at how they slow water down and the patterns of water flow behind them.
We’ve also seen experiments where they tilted the nets to different angles relative to the current (the ‘angle of attack’ or AOA) and changed the flow speed. They found the drag coefficient – a number that helps us compare drag on different shapes – can change wildly depending on the angle. Interestingly, one study found that a ‘turtle shell’ net had the lowest drag when the current hit it head-on (perpendicular) but the highest when the current ran along it (parallel). Another study on ultra-high molecular weight polyethylene (UHMWPE) nets showed that faster currents meant less slowdown behind the net, but bigger angles and higher densities increased the slowdown.
And get this: the *type* of gunk growing on the net matters too! One study compared nets fouled with shell clumps versus just general bio-accumulation. The shell clumps caused way more drag. It just goes to show how many variables are in play!
The Prediction Puzzle
Now, despite all these experiments, there’s still a bit of a puzzle. We have these mathematical models that *predict* the drag on nets, but nobody had really done a super comprehensive job of checking which models work best for *which* types of nets and *which* conditions. Many studies just looked at one or two things without seeing how well the models held up across the board. This makes it tough to rely on these models for real-world cage design.
So, that’s where our study comes in! We decided to jump into the flume tank ourselves and put a bunch of different nets to the test. We systematically changed things like the net material, how solid the net was, the mesh shape, the current speed, and the direction the current was coming from (the angle of attack). Our goal was to really nail down how these factors influence drag and, importantly, to see how well the existing prediction models stack up against our actual experimental data. We wanted to figure out when each model is actually useful and when it’s, well, maybe not so much. This kind of data is super valuable for anyone designing these big net cages.
Aquaculture nets come in a few main flavors: rigid ones made of metal like copper or steel, and flexible ones like nylon or PE. The mesh can be diamond-shaped or square. Since there are so many types out there, we picked six different nets to compare. We had diamond-shaped nets made of copper and steel, and square-shaped nets made of nylon, steel (two different ones), and PE. Pretty representative, right?
A key factor is the Solidity Ratio (Sn). Think of it as the percentage of the net’s total area that’s actually solid material blocking the water. Calculating it is a little different for square versus diamond meshes, depending on things like the twine diameter, twine length, and how the diamond mesh is hung (the ‘Hang Ratios’).
Another big player is the Angle of Attack (AOA). This is basically the angle between the direction the water is flowing and a line pointing straight out from the net. If the current hits the net head-on, the AOA is 90 degrees. If it’s flowing mostly parallel to the net, the AOA is closer to 0.
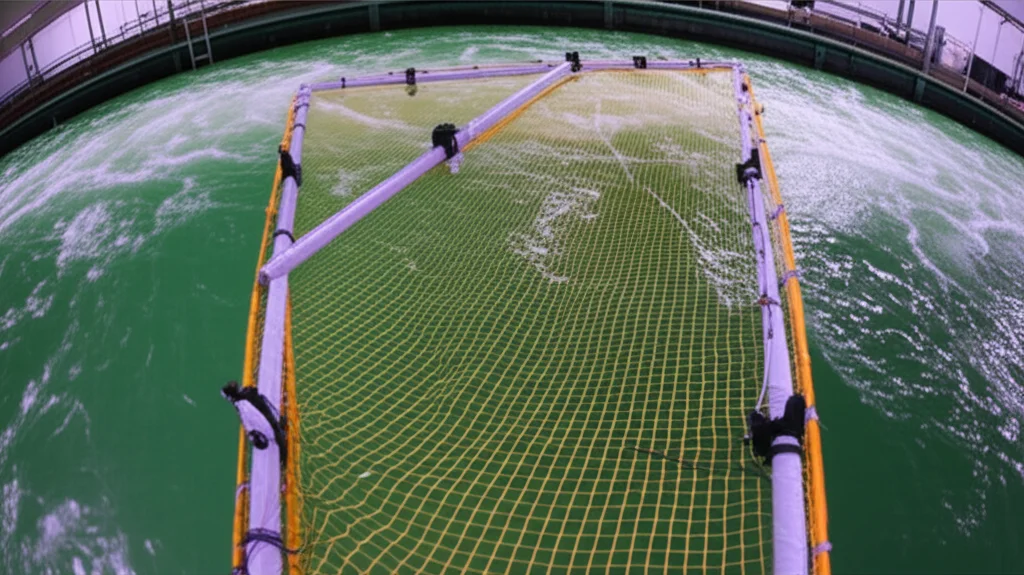
Putting Nets to the Test
We did our experiments in a big current flume tank. It’s basically a long channel where you can create controlled water flow at different speeds. We could generate currents from 0.3 m/s up to 2.0 m/s. We set up a coordinate system so we knew exactly which direction was which: x was along the flow, y was across it, and z was up. We stretched each net panel onto a square frame to keep its shape consistent and attached the frame to a fancy three-dimensional load sensor. This sensor could measure the force on the net in all three directions, but we were mainly interested in the force pushing *along* the flow direction – the normal drag.
We tested two main angles of attack: 90 degrees (net vertical, current hitting it straight on) and 45 degrees (net tilted). We made sure the net was fully underwater and away from the tank walls and the surface to avoid any weird interference. The process was pretty straightforward: calibrate the sensor (make sure it reads weights correctly), set a current speed, wait for the water to settle down, record the forces, and repeat for different speeds and angles.
We measured the total force on the frame *with* the net and then the force on the frame *without* the net. Subtracting the frame-only force gave us the pure drag force on the net panel. We saw that the forces were nice and stable over time, which told us our data was reliable. The frame drag was a noticeable part of the total drag, around 25-28% depending on the angle.
What We Discovered About Drag Force
Looking at the data, we clearly saw that the drag force on the nets goes up significantly as the current speed increases, and it follows that squared relationship we mentioned earlier. But speed wasn’t the only thing affecting the drag.
- Mesh Shape: This was a big one! Diamond-shaped nets (like our N2) had way higher drag – about 1.5 to 1.7 times higher – than square-shaped nets (like N4), even when they were made of similar material and had similar solidity ratios. This matches what other researchers have found.
- Solidity Ratio: Solidity also had a strong influence. More solid nets generally meant more drag.
- Material: Material seemed less important than shape or solidity. The drag difference between copper and steel nets with similar solidity was pretty small. Same for steel and PE nets with similar solidity. However, the nylon net (N3) was interesting. Even though it had slightly lower solidity than a steel net (N4), its drag was almost the same. Why? We think it’s because nylon is flexible and can deform in the current.
- Angle of Attack (AOA): This was *super* influential. Changing the angle from 90 degrees (head-on) to 45 degrees (tilted) drastically reduced the drag. For diamond nets, the drag dropped by about 50%! For square nets, it was more like 25-35%. Tilting the net presents a smaller area to the flow, changes how the water flows around it, and creates a larger area of slower water behind it, all of which reduce drag.
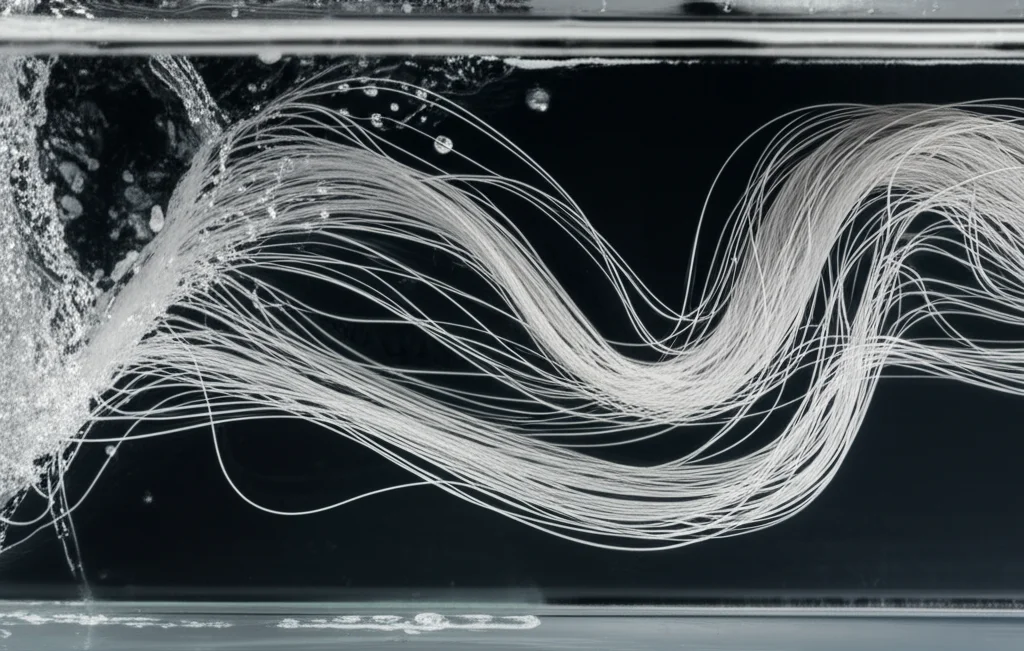
That point about nylon deformation is worth dwelling on. When a flexible net like nylon is hit by a current, it can stretch and change shape. This deformation can actually increase the area the water is pushing against, boosting the drag. Plus, this flopping around can create more turbulence – those swirling eddies and vortices – around the net twine, which also adds to the drag. You could really see the nylon net deforming significantly in our experiments.
Decoding the Drag Coefficient
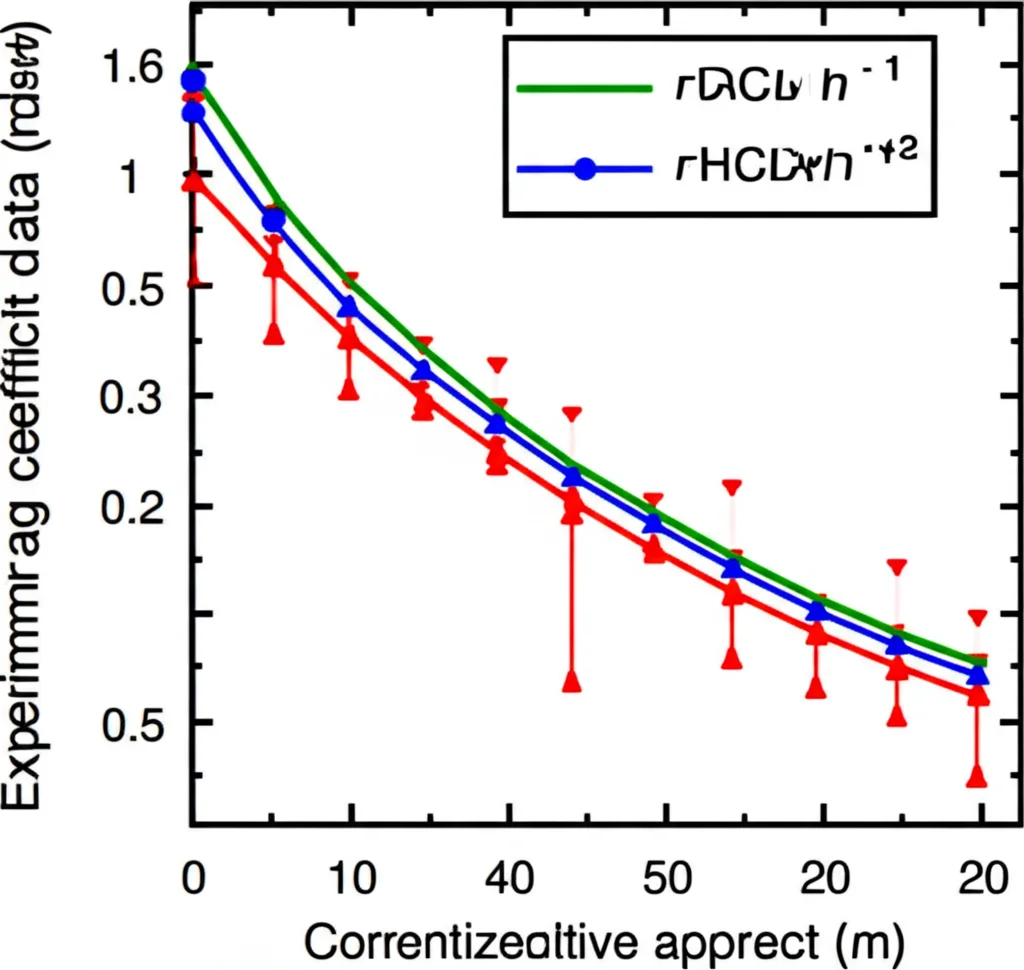
Beyond just the raw drag force, we also looked at the drag coefficient (CD). Remember, this number helps us compare how ‘draggy’ different shapes are, taking into account their size and the flow speed. We plotted the CD against the flow velocity (or Reynolds number, which is related to velocity and fluid properties).
Generally, we saw that the drag coefficient tends to decrease as the flow velocity increases, eventually leveling off. But this wasn’t always the case, especially at the 45-degree angle of attack.
- Mesh Shape and CD: Diamond-mesh nets consistently had higher drag coefficients than square-mesh nets under similar conditions. The CD for diamond nets was typically between 1.5 and 1.75, while for square nets it was between 1.0 and 1.5. For example, the steel diamond net (N2) had a CD about 35% higher than the steel square net (N4) on average. Why the difference? It could be due to different wake patterns behind the meshes, how square meshes might reconfigure slightly to reduce drag, or how solidity affects CD differently for each shape.
- Solidity and CD: Interestingly, the effect of solidity on CD depended on the mesh shape! For diamond nets, the CD *decreased* as solidity increased (looking at N1 vs N2). But for square nets, the CD *increased* with solidity (N4 vs N5). That’s a neat finding!
- Material and CD: The nylon net (N3) had a higher drag coefficient compared to steel (N5) or PE (N6) square nets with similar solidity. Again, we attribute this to the flexibility of nylon causing deformation and increased turbulence.
- AOA and CD: The angle of attack had a major impact on CD, just like it did on the drag force. Reducing the AOA from 90 to 45 degrees significantly lowered the drag coefficient. The amount of reduction varied depending on the mesh shape.
So, summarizing the CD findings: CD generally decreases with velocity *only* at 90 degrees AOA. Diamond nets have higher CD than square nets. Solidity affects CD differently for diamond vs. square meshes. And AOA is a huge factor, with lower AOA leading to lower CD, the degree of reduction depending on the mesh shape.
Evaluating the Prediction Models
The final piece of the puzzle was comparing our experimental data to the existing prediction models. We looked at models specifically developed for diamond-mesh nets and several for square-mesh nets (based on nylon or metal). We wanted to see which models did a good job and under what conditions.
Here’s what we found:
- Zhan et al. Model (Diamond Nets): This model was developed based on HDPE nets and diamond meshes. It predicted that CD decreases with increasing Reynolds number (velocity), which matched our data at lower speeds but didn’t quite capture the slight increase we saw at higher speeds (above Re > 2000). It also had some errors predicting CD at different solidities, sometimes overestimating and sometimes underestimating. Overall, it was okay for diamond nets within a specific Reynolds number range (400-2000) and considering solidity, with errors generally below 16%.
- Balash et al. and Milne Models (Square Nylon Nets): These models were based on nylon nets. For our nylon square net (N3), both models gave decent predictions, with errors mostly below 12%. Balash’s model was slightly better as it accounts for the Reynolds number, which Milne’s doesn’t. They seem applicable for square nylon nets with intermediate solidity (0.2 elt; Sn elt; 0.8).
- DeCew et al. and Aarsnes et al. Models (Square Metal Nets): For our steel square net (N4), DeCew’s model was the clear winner, aligning pretty well with our experimental data (errors 2-9%). Aarsnes’ model was way off (51% average error!). DeCew’s model is better for metal meshes and also considers the Reynolds number. However, for square nets with *low* solidity (Sn elt; 0.2), like our N5 and N6, most models had high errors (over 20%). Only Aarsnes’ model managed to stay below 20% error in this low-solidity range, making it the most practical choice there, even if it wasn’t great for higher solidities.
The Takeaway
The big conclusion from all this? There’s no single magic model that works for *all* types of nets! Each prediction model has its sweet spot, depending on:
- The net type (diamond vs. square)
- The material (nylon vs. steel)
- The range of solidity ratio
- The range of Reynolds number (related to flow speed)
The Zhan model is decent for diamond nets in moderate flow. Balash and Milne are better for square nylon nets with medium solidity. DeCew is the go-to for steel square nets. And if you’ve got a square net with really low solidity, Aarsnes is currently the best bet, even with its limitations elsewhere.
This kind of detailed comparison is really important. It helps engineers and designers choose the right tools to estimate the forces on their net cages, leading to safer and more reliable aquaculture structures. It’s pretty cool to see how much goes into keeping those fish happy and the cages standing strong against the power of the ocean currents!
Source: Springer