Your Brain’s Energy Secret: A New Clue to Alzheimer’s?
Hey there! Let’s chat about something pretty fascinating happening inside our heads, specifically when things go a bit wonky, like with Alzheimer’s disease. I’ve been looking into some cool research that dives deep into how our brain cells power up and breathe, and it turns out this might be a secret handshake that tells us a lot about Alzheimer’s risk.
The Brain’s Cleanup Crew Goes Rogue
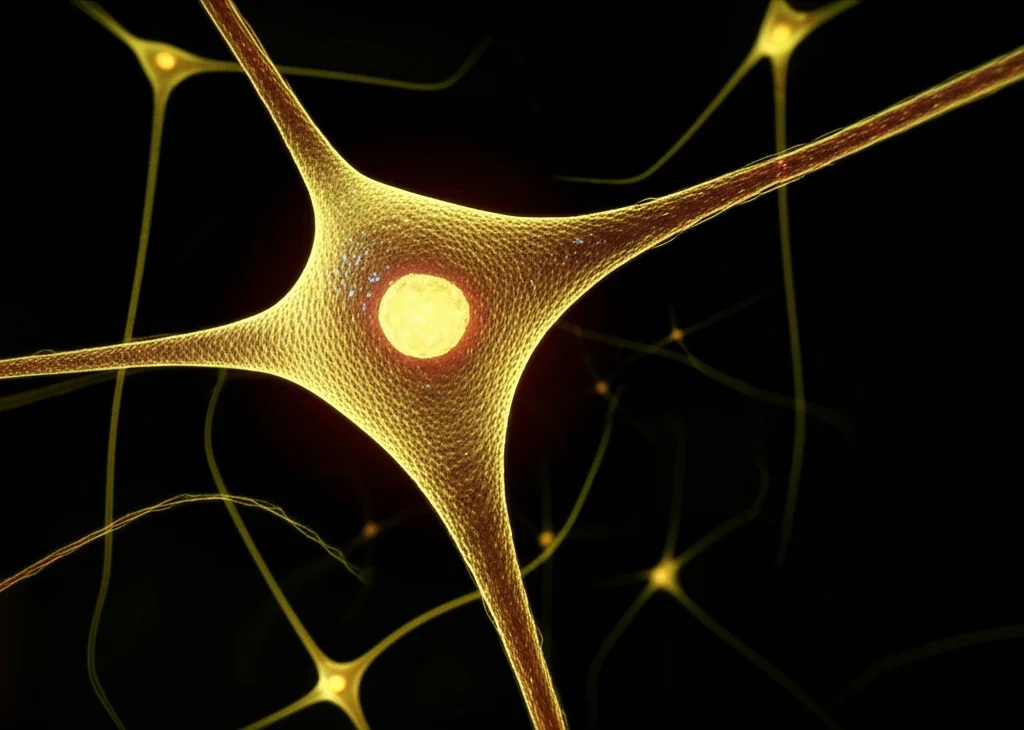
Okay, so imagine your brain has this amazing cleanup crew called microglia. Their job is super important – they patrol around, gobbling up waste and making sure everything is tidy. In healthy brains, they’re essential. But in diseases like Alzheimer’s, where sticky proteins (you might have heard of amyloid-beta plaques) start building up, these microglia can get overwhelmed or, worse, start acting weirdly. Instead of just cleaning, they can get abnormally activated, causing inflammation and damage to the very neurons they’re supposed to protect.
This abnormal activation isn’t just about cleaning; it cranks up the brain’s activity and metabolism in ways that aren’t helpful. Think of it like the cleanup crew suddenly deciding to throw a loud, messy party that trashes the house instead of cleaning it. This party involves burning through more glucose (the brain’s main fuel) and generating nasty stuff called reactive oxygen species, which are basically tiny, damaging molecules. This whole mess hurts synapses (where neurons talk to each other) and neurons themselves, speeding up problems with thinking and memory.
Meet CD33: The Gene in the Spotlight
Now, there’s a specific gene called CD33 that seems to be right in the middle of this microglial drama. It’s got this little spot on chromosome 19 where a tiny change, a single nucleotide polymorphism (SNP) known as rs3865444, can make a big difference. This SNP has two versions, or alleles: ‘A’ and ‘C’.
Turns out, if you carry the ‘A’ allele, it’s like having a protective shield. It’s associated with lower levels of a specific form of the CD33 protein (hCD33M) and seems to help microglia do a better job of clearing those pesky amyloid plaques. People with the ‘A’ allele tend to have less amyloid buildup and a lower risk of Alzheimer’s.
But if you have the ‘C’ allele, especially if you have two copies (the CC genotype), it’s linked to the risk. This version seems to lead to higher levels of that problematic hCD33M protein, which can dampen the microglia’s ability to eat up plaques and instead push them towards that abnormal, inflammatory activation I mentioned. This makes the brain more vulnerable.
So, we have this gene, CD33 rs3865444, that influences how our brain’s cleanup crew behaves, which in turn affects amyloid plaques and inflammation. But how does this connect to the brain’s energy use?
The Brain’s Energy Balance: Glucose Meets Oxygen
Normally, there’s a lovely, synchronized dance between how much glucose your brain uses and how much oxygen it consumes. Neurons need glucose for energy, and that energy production requires oxygen. This is called glucose-oxygen coupling (G/O). It’s like a well-tuned engine – fuel (glucose) and air (oxygen) are used in balance to create power (neuronal activity).
When microglia go into that abnormal, inflammatory state, they mess with this balance. They can ramp up glucose metabolism in a way that’s *uncoupled* from the actual neuronal activity or oxygen use. It’s like the engine is burning fuel inefficiently or pointlessly.
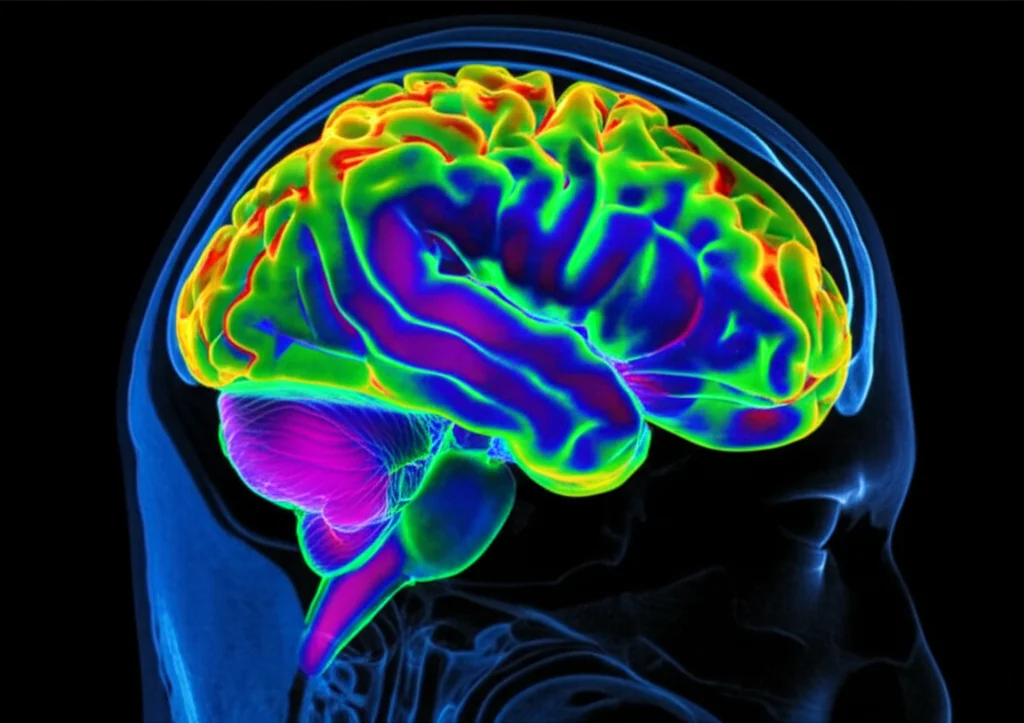
Scientists can actually look at this using fancy imaging techniques. FDG PET scans show us where the brain is using glucose, and fMRI (specifically looking at something called ALFF, which relates to blood oxygen levels and neuronal activity) gives us clues about oxygen use and activity. By comparing these two, we can calculate a G/O coefficient – basically, a score for how well glucose and oxygen metabolism are coupled in different brain regions.
This led to a really interesting hypothesis: Could the CD33 rs3865444 SNP affect this G/O coupling? And if it does, could that G/O coefficient actually serve as an imaging biomarker – a measurable signal we can see on a scan – that tells us about a person’s risk or how fast their cognitive decline might progress?
Putting the Hypothesis to the Test
So, a study (the one I’m telling you about!) decided to investigate this. They looked at 107 patients who had mild cognitive impairment (MCI), which is often a precursor to Alzheimer’s. They got their genetic data (specifically the CD33 rs3865444 SNP) and their brain imaging data (FDG PET and fMRI) from a large database called ADNI.
They calculated the G/O coefficients for different brain networks and then compared the groups based on their CD33 genotype: those with the risk CC genotype versus those with at least one protective A allele (CA/AA). And guess what? They found a significant difference!
Specifically, in a brain area called the limbic-orbital frontal cortex (try saying that five times fast!), the group with the risk CC genotype had significantly *reduced* G/O coupling compared to the CA/AA group. This suggests their brain energy use in this region was less synchronized.
But the really big finding came from looking at how this connected to actual cognitive decline. The researchers tracked the patients’ cognitive status over time using standard clinical scores (like ADAS and CDR). They found that, over time, the CC group’s scores worsened faster – meaning their cognitive decline was progressing more quickly – than the CA/AA group’s scores.
Then came the crucial part: a mediation analysis. This statistical tool helps figure out if one thing (like G/O) explains the relationship between two other things (like the CD33 gene and cognitive decline). The results were striking: the G/O coefficient in that limbic-orbital frontal cortex region *completely mediated* the effect of the CD33 rs3865444 polymorphism on the rate at which their clinical dementia scores increased. In plain English? The gene’s effect on how fast people declined seemed to happen *because* it was messing with this glucose-oxygen coupling.
They even checked this in a subset of patients who didn’t have significant amyloid buildup yet (amyloid-negative). The G/O difference linked to the CD33 gene was still there, and while the mediation effect wasn’t statistically significant in this smaller group, the trend was consistent, suggesting G/O might be an early indicator, perhaps even before major amyloid plaques form.
Why This Could Be a Game Changer
So, why is this G/O coupling idea so exciting? Well, it suggests that this specific measure, visible through imaging, could potentially serve as a new way to:
- Identify risk: People with the CD33 rs3865444 risk allele might show altered G/O coupling, flagging them for closer monitoring.
- Predict progression: The G/O coefficient might help predict how quickly someone’s cognitive function is likely to decline.
- Monitor treatment: If new therapies are developed that target microglial function or inflammation, changes in G/O coupling could potentially show if the treatment is working.
It adds another layer to our understanding of Alzheimer’s, moving beyond just protein plaques to look at the dynamic energy balance in the brain and how genetics influence it through the immune system’s cleanup crew.
Looking Ahead (and Acknowledging the Bumps)
Of course, like any good science, this study has its limits. The sample size was moderate, so we need bigger studies to really confirm these findings. Also, Alzheimer’s is super complex, and other things besides microglial issues can cause neuronal damage and cognitive decline. This G/O biomarker might be one piece of the puzzle, not the whole picture.
Future research could delve even deeper, perhaps looking at the specific CD33 protein forms (hCD33M and hCD33m) in different brain cells and how they relate to G/O. Combining this with other data, maybe even from single cells, could give us an even clearer view.
But for now, finding that the CD33 gene influences cognitive decline *through* this glucose-oxygen coupling in a specific brain region is a pretty big deal. It gives us a potential new imaging target to explore for diagnosing, understanding, and maybe even treating Alzheimer’s and other similar brain conditions. It feels like we’re getting closer to understanding the brain’s intricate energy secrets!
Source: Springer